Attribution Windows and How They Work in WorkMagic

by
Daniel Oh, Director of Product Marketing
Last updated:
Last updated:
How attribution windows work — and how to use them in WorkMagic
Performance marketers live in multiple time horizons at once. You're making a bid decision today, running a creative test this week, and justifying channel investment to finance this quarter.
Attribution windows exist because each of those decisions deserves its own lens, and using the wrong one leads to misinterpretation. Those numbers look off, and you're right to pause on them. But it's not the underlying data, it's the filter you're seeing it through.
What an attribution window is
An attribution window defines how much time can pass between an ad touchpoint and a purchase for that touchpoint to be considered for the conversion credit.
Set a 30-day window, and a customer who clicked your Meta ad on the 1st and bought on the 28th counts. Set a 7-day window, and that same journey falls outside the view — not because the attribution model changed, but because you've asked a narrower question: which touchpoints drove purchases within the last 7 days?
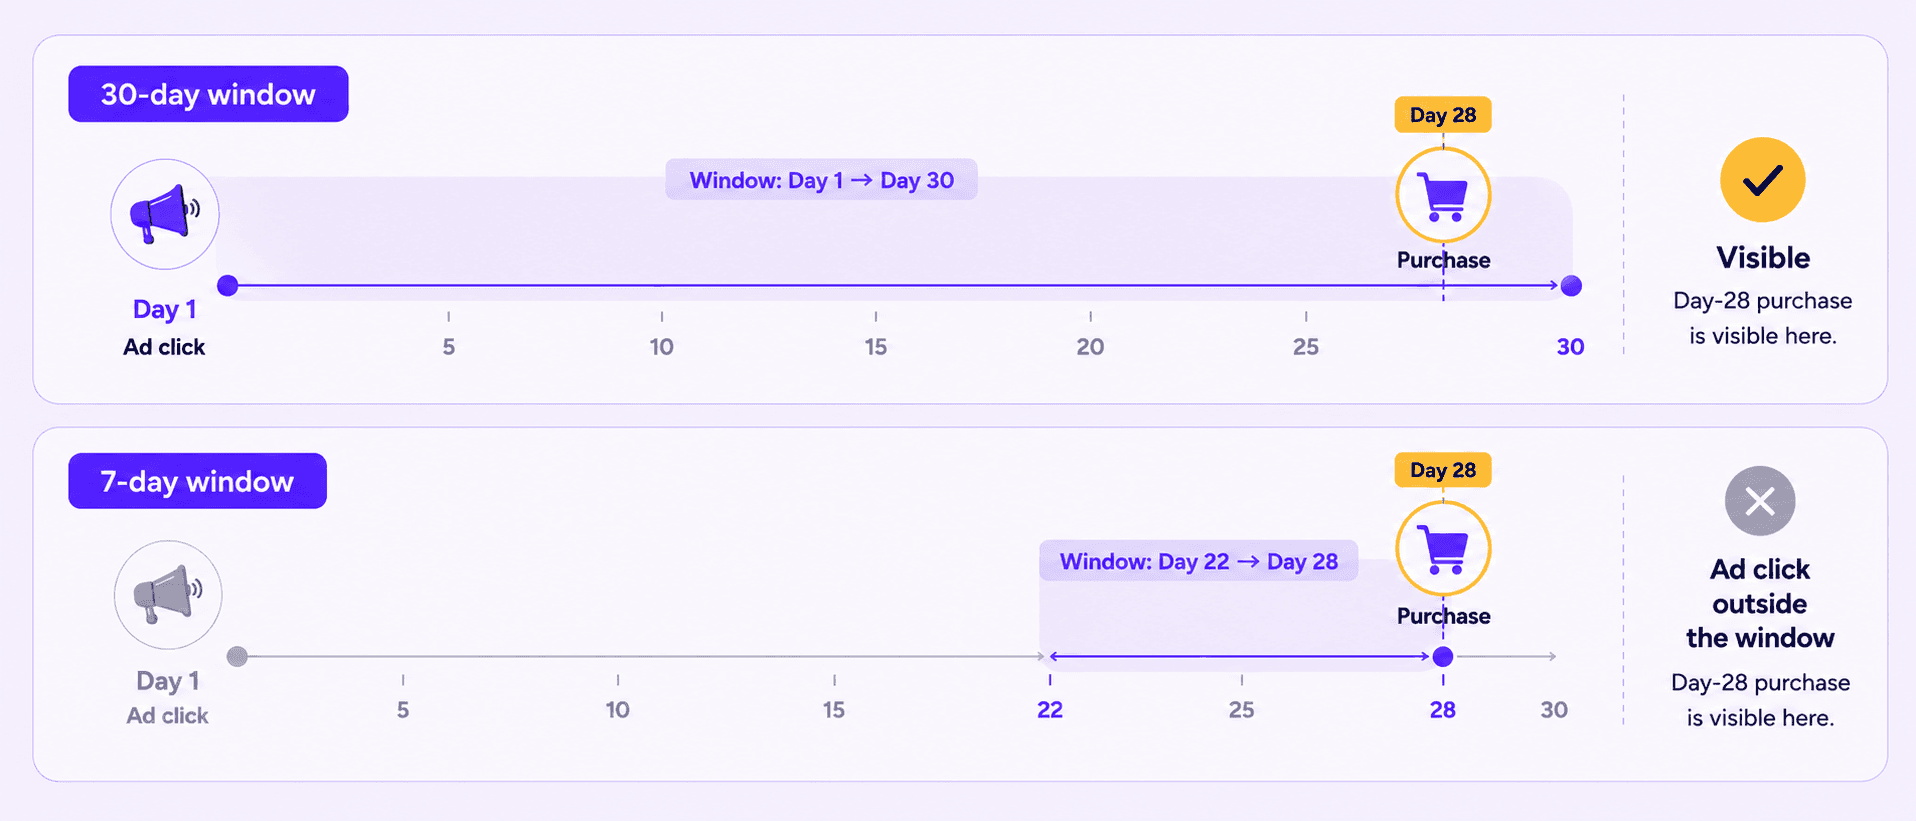
This distinction matters more than it might seem. Attribution windows don't change how credit is assigned, that's the attribution model's job (whether it's last click, first click, or in our case, incrementality calibrated). Attribution windows instead change which credited conversions are visible. The math underneath is the same; the scope of what surfaces are different.
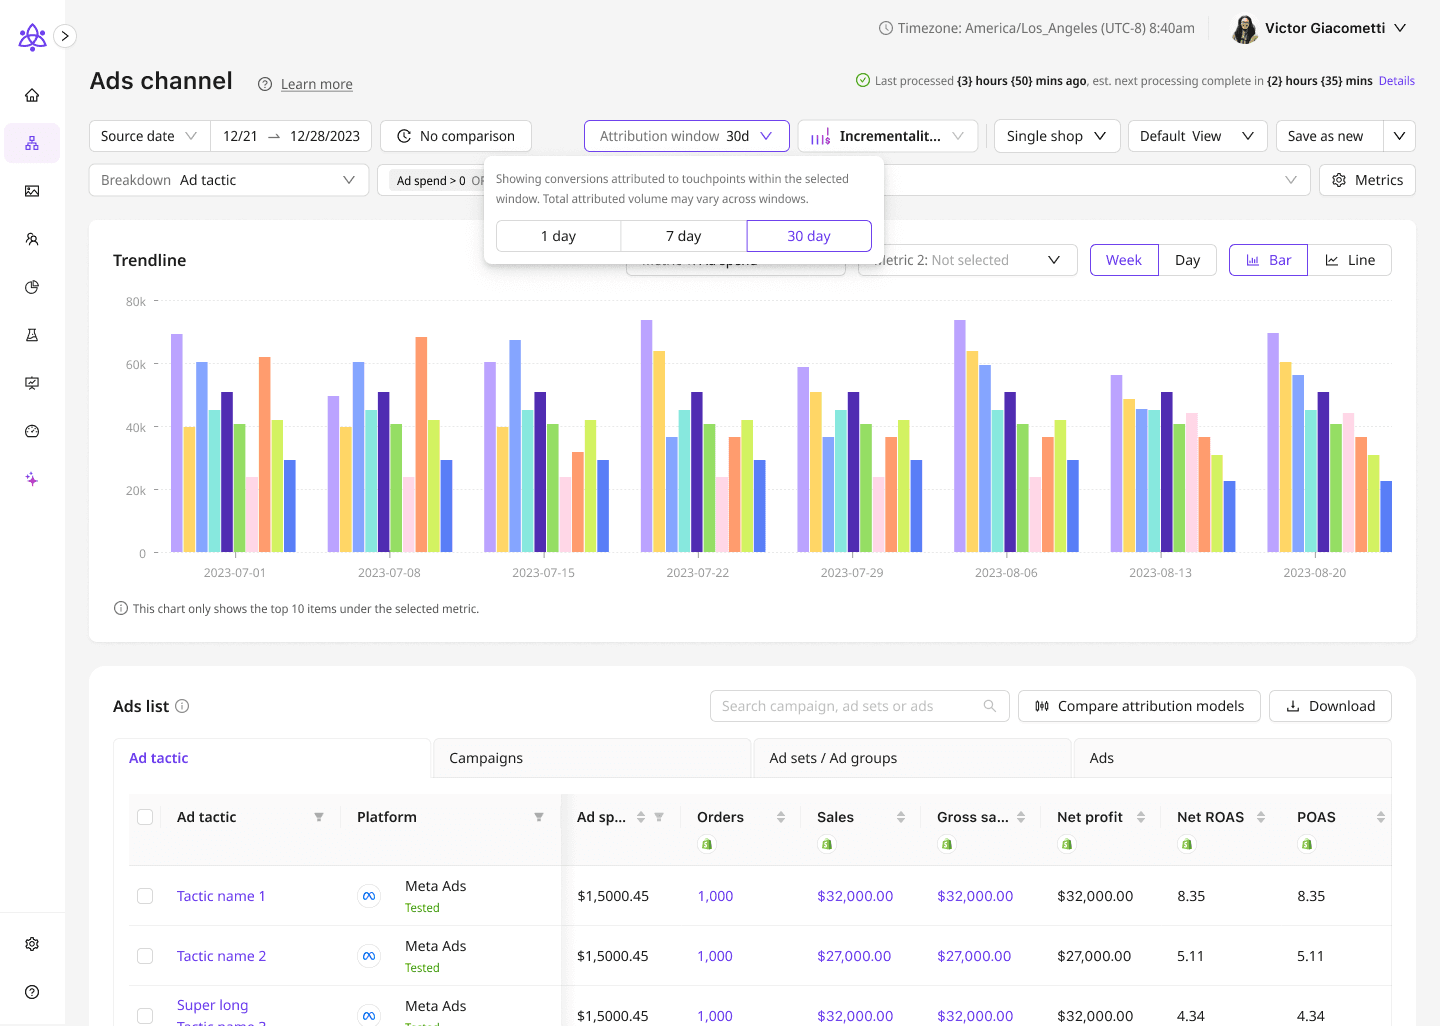
Most platforms surface some version of this. WorkMagic offers 1-day, 7-day, and 30-day windows, selectable from the attribution model control across all dashboards.
The mechanic that trips people up
When a touchpoint falls outside the selected window, its credit is hidden — not redistributed to whatever else is still in view.
This is easiest to see with an example. A customer clicks your Meta ad on January 1, clicks a Google ad on January 12, then buys $100 on January 15. To make this easier, we'll assume a linear credit split, but the concept also applies to our data-driven and incrementality-calibrated attribution models:
Window | Meta | Total shown | |
30-day | $50 | $50 | $100 |
7-day | $0 | $50 | $50 |
1-day | $0 | $0 | $0 |
On the 7-day view, Google doesn't absorb Meta's share - it still gets its $50. Meta's $50 simply doesn't appear. The missing credit goes nowhere: it isn't reclassified as organic, direct, or unattributed. The Meta contribution still exists in the underlying data; it just has no visible touchpoint credit on that window.
The practical consequence: channel rows will sum to less than the All Channels total on shorter windows, and the gap widens the tighter the window gets. That gap is all of the credit that exists outside the window, so we won't report it unless you expand the window.
The same logic explains why ROAS drops on shorter windows even though spend doesn't. Spend is always the same — total media spend over the selected date range. What shrinks is attributed sales. Fewer sales over the same spend base produces a lower ROAS. The window is a narrower lens on credit, not a signal that the channel is underperforming.
Two dates, one dashboard
Before choosing a window, it's worth understanding that every attributed conversion has two timestamps: when the ad touchpoint happened (source date) and when the purchase happened (event date). WorkMagic lets you pivot on either, and the window behaves differently depending on which you choose.
Event date anchors the view on when purchases landed. The window looks backward from each purchase day and asks: how far back do we count touchpoints? A 7-day event date view of yesterday's sales counts touchpoints from the past 7 days.
Source date anchors the view on when touchpoints happened. The window looks forward from each touchpoint day and asks: how far forward do we count conversions? A 7-day source date view of last Tuesday's touchpoints counts purchases that arrived within 7 days of that click.
These are complementary lenses, not competing ones: Event date is better for understanding what drove recent purchases. Source date is better for evaluating how productive a specific day of spend turned out to be.
The key is using the same date dimension consistently within any given workflow. Switching between them because one number looks better is the most common source of "why don't my dashboards match?" confusion.
Choosing the right configuration
The window and date dimension together produce six meaningful combinations. Here's how to match them to the decision you're actually making.
Config | What it answers | Use it for |
30-day + event date (default) | Which touchpoints in the last 30 days affected the conversion | Finance reporting, QBRs, MBO review, lift calibration |
7-day + event date | Which touchpoints in the last 7 days affected the conversion | Weekly creative reviews, mid-flight pacing |
1-day + event date | Which touchpoints in the last 24 hours affected the conversion | Same-day response share, fast-cycle categories |
30-day + source date | Which purchases were driven by a touchpoint in the last 30 days | Channel-level efficiency over a full cycle |
7-day + source date | Which purchases were driven by a touchpoint in the last 7 days | Short-cycle media efficiency by source day |
1-day + source date | Which purchases were driven by a touchpoint in the last 24 hours | Same-day bid and spend validation |
The most useful shorthand for thinking about which window to default to: plan on 30, pace on 7, optimize on 1.
What each window is built for
30-day: planning, reporting, and calibration
Thirty days is the full-cycle view. It captures the complete consideration journey for most product categories — including the customers who clicked on a Tuesday and didn't buy until two weeks later.
This is the right window for anything that needs to be stable and comparable over time: quarterly revenue reporting, budget scenario viewing, and lift test reconciliation. When you're asking "how much did Meta drive last quarter?" or "did the budget shift we made in April actually work?", 30-day event date is the config that answers it cleanly.
It's also the window that keeps WorkMagic's three pillars - Attribution, Geo Lift, and MMM - aligned with each other. Geo Lift measures full incremental impact across the entire purchase lag. MBO is trained on the 30-day attribution dataset and forecasts cumulative outcomes over a full cycle.
Comparing either of those to a 7-day attributed ROAS will produce a gap, not because something is miscalibrated, but because you're comparing a full-cycle measurement to a partial one.
This is our default setting for that reason and is the most comprehensive picture of marketing impact on business.
7-day: pacing and creative decisions
Seven days is the operational window. It's recent enough to reflect current performance and stable enough that you're not reacting to a single outlier day.
For weekly creative reviews, a 7-day event-date view over the trailing week is the right frame. Long enough to smooth noise across A/B test variance, short enough that older creatives aren't dragging the average.
For example: If Hero Variant A is running 7-day ROAS of $2.80 and Variant B is at $1.80, that's a clear-enough signal to rotate B out for next week.
For mid-flight scenario pacing, the same config tells you whether you're on track, with the important caveat that 7-day ROAS will always read lower than the final 30-day result. Conversions with longer consideration cycles haven't landed yet. If you're on day 10 of a 30-day scenario and the 7-day read looks soft, the right question is whether the trend is moving in the right direction, not whether the number matches the forecast, which was built against a 30-day full-cycle measurement.
1-day: same-day signal and bid validation
One day is the fastest-feedback loop available and is built for same-day optimization and day trading. It isolates yesterday's touchpoints and yesterday's conversions, which makes it useful for one specific question: did an optimization decision made in the last 24 hours show up in same-day response?
If you raised Meta bids on Tuesday afternoon, pull source date + 1-day for Tuesday on Wednesday morning. If 1-day ROAS moved from $1.10 to $1.30 versus the prior day on the same config, that's a signal worth watching for another day before scaling the change. If it didn't move, the bid adjustment may not have cleared enough auction volume yet, or same-day response for that channel is naturally thin.
What 1-day can't tell you: whether the channel is performing well overall. A lot of purchase journeys are longer than a day, especially if you're a high AOV brand. To that end, we recommend 1-day views solely for same-day use cases like day trading.
Where shorter windows mislead
A 7-day or 1-day view is a filter on a 30-day model, not an independent measurement. That creates a few interpretation traps worth knowing before you reach for a shorter window.
"My channel ROAS looks worse on 7-day — is it degrading?" Validate if it's a window issue before raising a performance flag. Switch to 30-day and look at the same trend. If 30-day ROAS is flat, the 7-day gap is just the mechanic. If 30-day is also declining, that's worth investigating.
"My 7-day ROAS is way below my lift result — is the model wrong?" Not likely. Geo Lift captures the full incremental tail, including delayed conversions that fall past a 7-day lookback. A lift-to-attribution comparison should always use 30-day attribution as the baseline. The gap between 7-day and 30-day is roughly the share of conversions arriving on a longer lag.
"The numbers don't match across windows — is this a data issue?" If channel rows don't sum to the All Channels total on a shorter window, that's the out-of-window credit gap described above. It's displayed behavior, not missing data. The UI surfaces a tooltip explaining this so you can orient quickly without digging.
The bottom line
Attribution windows are a precision tool meant to provide different views for different insights, but you have to match each window to the right question you want to answer. And the question you should be asking depends entirely on the decision in front of you.
Use 30-day when you need stability, comparability, and cross-pillar alignment. Use 7-day when you need a weekly operational read on pacing or creative. Use 1-day when you need the fastest possible feedback loop on a specific optimization move.
Pick one config per workflow. Use it consistently. And when a number looks surprising, check which window you're on before drawing a conclusion.
How attribution windows work — and how to use them in WorkMagic
Performance marketers live in multiple time horizons at once. You're making a bid decision today, running a creative test this week, and justifying channel investment to finance this quarter.
Attribution windows exist because each of those decisions deserves its own lens, and using the wrong one leads to misinterpretation. Those numbers look off, and you're right to pause on them. But it's not the underlying data, it's the filter you're seeing it through.
What an attribution window is
An attribution window defines how much time can pass between an ad touchpoint and a purchase for that touchpoint to be considered for the conversion credit.
Set a 30-day window, and a customer who clicked your Meta ad on the 1st and bought on the 28th counts. Set a 7-day window, and that same journey falls outside the view — not because the attribution model changed, but because you've asked a narrower question: which touchpoints drove purchases within the last 7 days?
This distinction matters more than it might seem. Attribution windows don't change how credit is assigned, that's the attribution model's job (whether it's last click, first click, or in our case, incrementality calibrated). Attribution windows instead change which credited conversions are visible. The math underneath is the same; the scope of what surfaces are different.
Most platforms surface some version of this. WorkMagic offers 1-day, 7-day, and 30-day windows, selectable from the attribution model control across all dashboards.
The mechanic that trips people up
When a touchpoint falls outside the selected window, its credit is hidden — not redistributed to whatever else is still in view.
This is easiest to see with an example. A customer clicks your Meta ad on January 1, clicks a Google ad on January 12, then buys $100 on January 15. To make this easier, we'll assume a linear credit split, but the concept also applies to our data-driven and incrementality-calibrated attribution models:
Window | Meta | Total shown | |
30-day | $50 | $50 | $100 |
7-day | $0 | $50 | $50 |
1-day | $0 | $0 | $0 |
On the 7-day view, Google doesn't absorb Meta's share - it still gets its $50. Meta's $50 simply doesn't appear. The missing credit goes nowhere: it isn't reclassified as organic, direct, or unattributed. The Meta contribution still exists in the underlying data; it just has no visible touchpoint credit on that window.
The practical consequence: channel rows will sum to less than the All Channels total on shorter windows, and the gap widens the tighter the window gets. That gap is all of the credit that exists outside the window, so we won't report it unless you expand the window.
The same logic explains why ROAS drops on shorter windows even though spend doesn't. Spend is always the same — total media spend over the selected date range. What shrinks is attributed sales. Fewer sales over the same spend base produces a lower ROAS. The window is a narrower lens on credit, not a signal that the channel is underperforming.
Two dates, one dashboard
Before choosing a window, it's worth understanding that every attributed conversion has two timestamps: when the ad touchpoint happened (source date) and when the purchase happened (event date). WorkMagic lets you pivot on either, and the window behaves differently depending on which you choose.
Event date anchors the view on when purchases landed. The window looks backward from each purchase day and asks: how far back do we count touchpoints? A 7-day event date view of yesterday's sales counts touchpoints from the past 7 days.
Source date anchors the view on when touchpoints happened. The window looks forward from each touchpoint day and asks: how far forward do we count conversions? A 7-day source date view of last Tuesday's touchpoints counts purchases that arrived within 7 days of that click.
These are complementary lenses, not competing ones: Event date is better for understanding what drove recent purchases. Source date is better for evaluating how productive a specific day of spend turned out to be.
The key is using the same date dimension consistently within any given workflow. Switching between them because one number looks better is the most common source of "why don't my dashboards match?" confusion.
Choosing the right configuration
The window and date dimension together produce six meaningful combinations. Here's how to match them to the decision you're actually making.
Config | What it answers | Use it for |
30-day + event date (default) | Which touchpoints in the last 30 days affected the conversion | Finance reporting, QBRs, MBO review, lift calibration |
7-day + event date | Which touchpoints in the last 7 days affected the conversion | Weekly creative reviews, mid-flight pacing |
1-day + event date | Which touchpoints in the last 24 hours affected the conversion | Same-day response share, fast-cycle categories |
30-day + source date | Which purchases were driven by a touchpoint in the last 30 days | Channel-level efficiency over a full cycle |
7-day + source date | Which purchases were driven by a touchpoint in the last 7 days | Short-cycle media efficiency by source day |
1-day + source date | Which purchases were driven by a touchpoint in the last 24 hours | Same-day bid and spend validation |
The most useful shorthand for thinking about which window to default to: plan on 30, pace on 7, optimize on 1.
What each window is built for
30-day: planning, reporting, and calibration
Thirty days is the full-cycle view. It captures the complete consideration journey for most product categories — including the customers who clicked on a Tuesday and didn't buy until two weeks later.
This is the right window for anything that needs to be stable and comparable over time: quarterly revenue reporting, budget scenario viewing, and lift test reconciliation. When you're asking "how much did Meta drive last quarter?" or "did the budget shift we made in April actually work?", 30-day event date is the config that answers it cleanly.
It's also the window that keeps WorkMagic's three pillars - Attribution, Geo Lift, and MMM - aligned with each other. Geo Lift measures full incremental impact across the entire purchase lag. MBO is trained on the 30-day attribution dataset and forecasts cumulative outcomes over a full cycle.
Comparing either of those to a 7-day attributed ROAS will produce a gap, not because something is miscalibrated, but because you're comparing a full-cycle measurement to a partial one.
This is our default setting for that reason and is the most comprehensive picture of marketing impact on business.
7-day: pacing and creative decisions
Seven days is the operational window. It's recent enough to reflect current performance and stable enough that you're not reacting to a single outlier day.
For weekly creative reviews, a 7-day event-date view over the trailing week is the right frame. Long enough to smooth noise across A/B test variance, short enough that older creatives aren't dragging the average.
For example: If Hero Variant A is running 7-day ROAS of $2.80 and Variant B is at $1.80, that's a clear-enough signal to rotate B out for next week.
For mid-flight scenario pacing, the same config tells you whether you're on track, with the important caveat that 7-day ROAS will always read lower than the final 30-day result. Conversions with longer consideration cycles haven't landed yet. If you're on day 10 of a 30-day scenario and the 7-day read looks soft, the right question is whether the trend is moving in the right direction, not whether the number matches the forecast, which was built against a 30-day full-cycle measurement.
1-day: same-day signal and bid validation
One day is the fastest-feedback loop available and is built for same-day optimization and day trading. It isolates yesterday's touchpoints and yesterday's conversions, which makes it useful for one specific question: did an optimization decision made in the last 24 hours show up in same-day response?
If you raised Meta bids on Tuesday afternoon, pull source date + 1-day for Tuesday on Wednesday morning. If 1-day ROAS moved from $1.10 to $1.30 versus the prior day on the same config, that's a signal worth watching for another day before scaling the change. If it didn't move, the bid adjustment may not have cleared enough auction volume yet, or same-day response for that channel is naturally thin.
What 1-day can't tell you: whether the channel is performing well overall. A lot of purchase journeys are longer than a day, especially if you're a high AOV brand. To that end, we recommend 1-day views solely for same-day use cases like day trading.
Where shorter windows mislead
A 7-day or 1-day view is a filter on a 30-day model, not an independent measurement. That creates a few interpretation traps worth knowing before you reach for a shorter window.
"My channel ROAS looks worse on 7-day — is it degrading?" Validate if it's a window issue before raising a performance flag. Switch to 30-day and look at the same trend. If 30-day ROAS is flat, the 7-day gap is just the mechanic. If 30-day is also declining, that's worth investigating.
"My 7-day ROAS is way below my lift result — is the model wrong?" Not likely. Geo Lift captures the full incremental tail, including delayed conversions that fall past a 7-day lookback. A lift-to-attribution comparison should always use 30-day attribution as the baseline. The gap between 7-day and 30-day is roughly the share of conversions arriving on a longer lag.
"The numbers don't match across windows — is this a data issue?" If channel rows don't sum to the All Channels total on a shorter window, that's the out-of-window credit gap described above. It's displayed behavior, not missing data. The UI surfaces a tooltip explaining this so you can orient quickly without digging.
The bottom line
Attribution windows are a precision tool meant to provide different views for different insights, but you have to match each window to the right question you want to answer. And the question you should be asking depends entirely on the decision in front of you.
Use 30-day when you need stability, comparability, and cross-pillar alignment. Use 7-day when you need a weekly operational read on pacing or creative. Use 1-day when you need the fastest possible feedback loop on a specific optimization move.
Pick one config per workflow. Use it consistently. And when a number looks surprising, check which window you're on before drawing a conclusion.