How to measure marketing ROI

by
Faizi Zahari, Growth Marketing & Product Lead
You're looking at your Meta dashboard. ROAS reads 4:1, payback period looks fine. Then you model the counterfactual, the version of the quarter where that campaign never ran, and true incremental ROAS comes in closer to 1.8:1. The budget you'd been calling efficient is carrying a lot of dead weight.
Most brands confuse attribution with causality, and that confusion sits underneath almost every bad ROI number.
Platform-reported ROAS and last-click models can misattribute by anywhere from 66–98%. Anything that converts after an interaction gets counted for that channel, whether or not the channel had anything to do with it. So you overspend on weak tactics, starve strong ones, and watch growth flatten while spend keeps climbing.
Real ROI requires either a test or a statistical model that isolates the incremental effect: the sales that wouldn't have happened without the campaign. That's the job proper marketing measurement exists to do.
What does marketing ROI actually measure?
Marketing ROI is profit or revenue per dollar of marketing spend. The formula is easy enough: ROI = (Revenue Generated − Marketing Cost) / Marketing Cost × 100%. Defining "revenue generated" is the hard part, because the honest version is what causality supports, not what your attribution tool reports.
ROI is a business outcome. ROAS is a different thing: it measures immediate revenue per ad dollar and ignores margin entirely, which is why a channel can post strong ROAS and still lose money once COGS is accounted for. Both metrics are useful. Only one tells you whether marketing is profitable.
Skip the ROI calculation and you end up optimizing for a channel's top-line appeal rather than what it contributes to profit. The full explanation on what is marketing ROI article covers how this fits into a broader measurement strategy.
Why does platform attribution lie about your ROI?
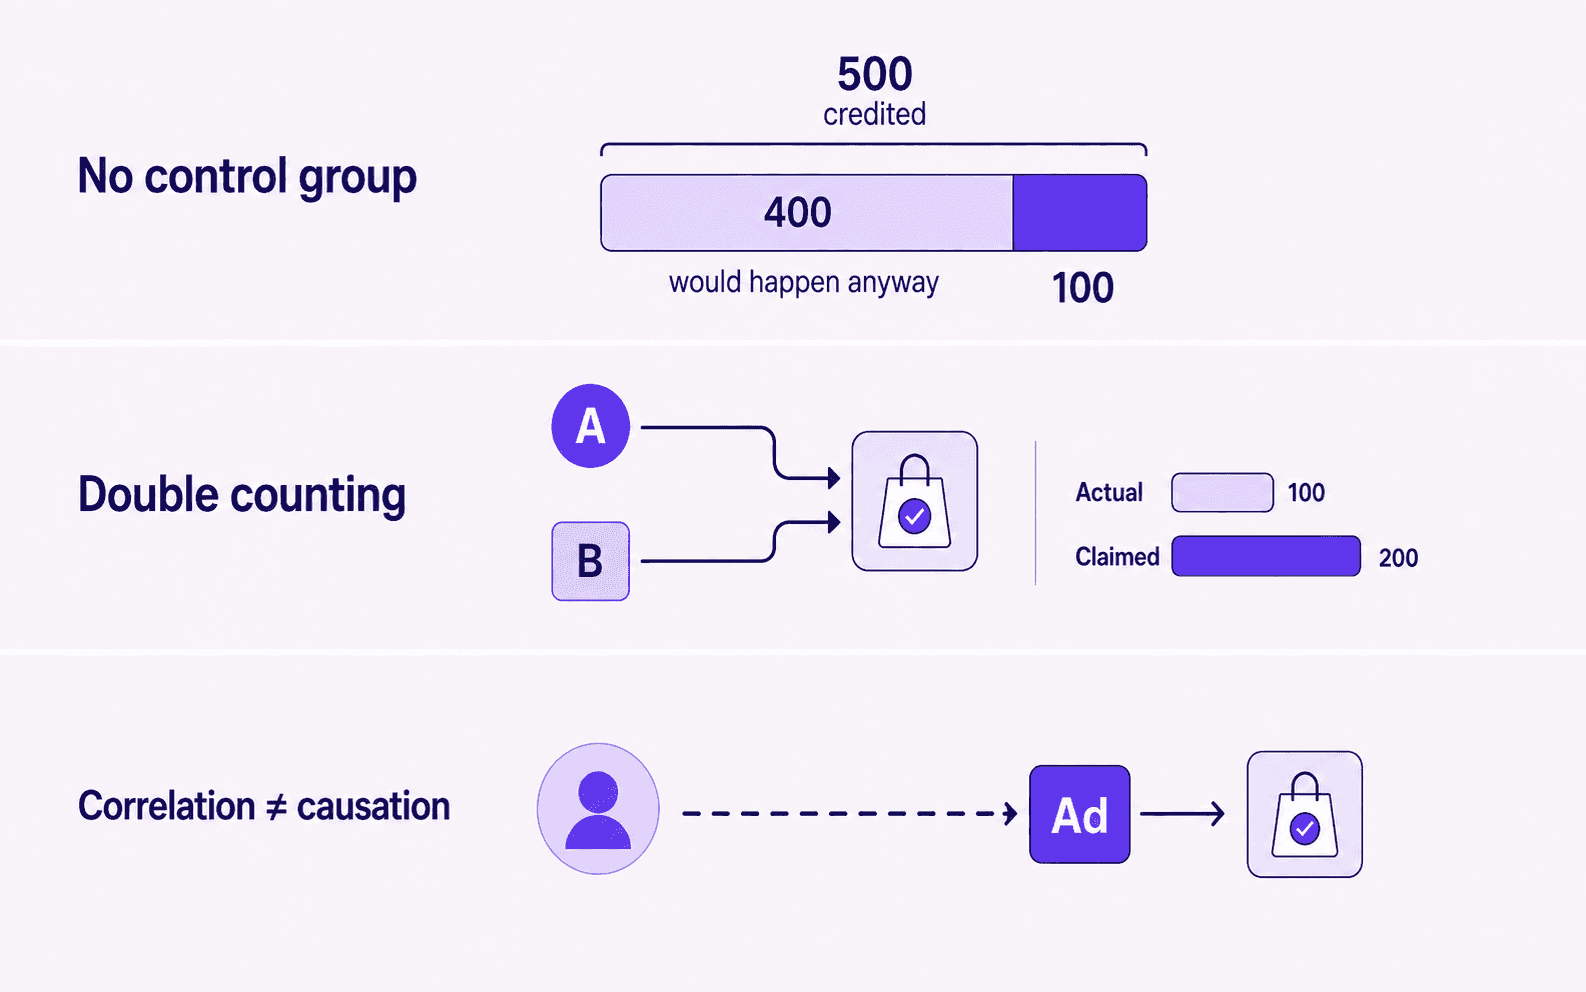
Meta, Google, TikTok and the rest run on last-click and view-through models, crediting either the final interaction before a conversion or any impression that was technically visible. Three things go wrong.
No control group exists. The model never asks how many of those conversions would have happened without the ad. Ten thousand people see your ad, 500 convert, the platform books 500 sales. If 400 of them were going to buy anyway, the real number is 100.
Shared touchpoints get double-counted. A user sees a TikTok ad, clicks a Google search result, then buys. Both platforms claim the sale. Add up channel-level reporting and you'll often clear your actual revenue.
Correlation gets read as causation. People who see your ads already skew toward interest in your category, which makes them likelier to convert regardless. No platform model separates the ad's effect from that baseline propensity.
These are structural limits rather than bugs waiting to be patched. Marketing attribution models have them by design, and recognizing that is step one toward measuring ROI accurately.
How do you measure incremental ROI instead?
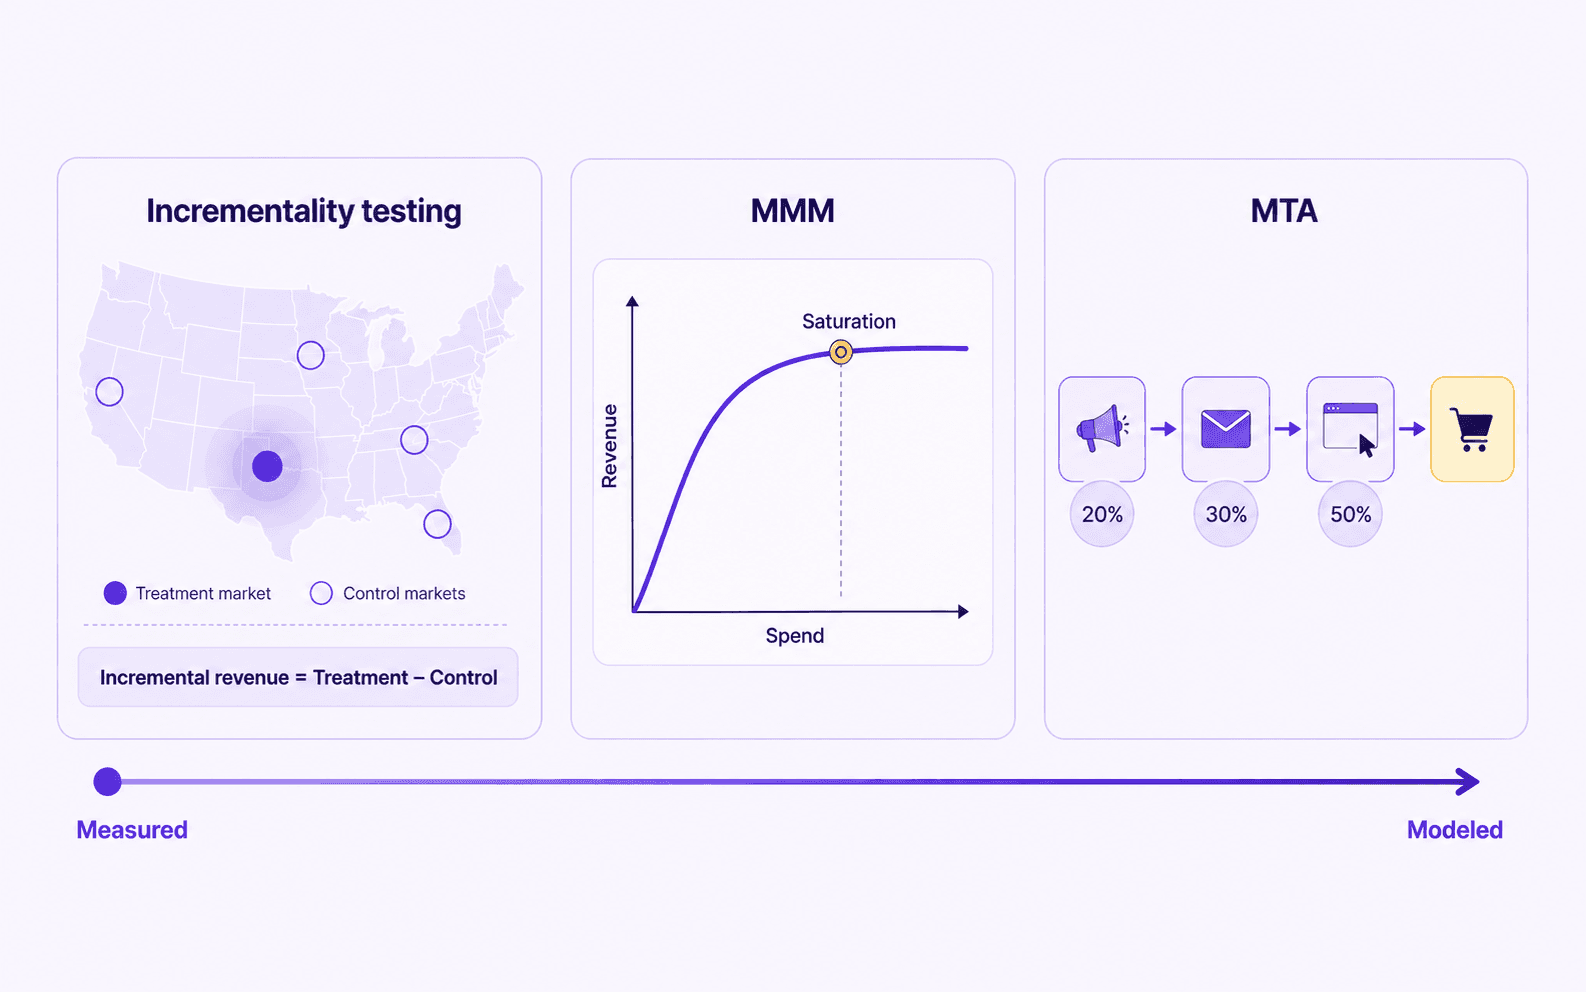
There are three core methods, and the strongest programs run all three.
Incrementality testing, also called lift testing, is the most direct. Split users or geographies into treatment and control, expose one side to the tactic, and measure the difference in sales. That difference is your incremental revenue.
Geo incrementality testing works especially well at scale. Run the campaign in a subset of markets, pause it in comparable ones, then compare sales across a few weeks. DTC brands use this constantly for channel validation and budget reallocation.
The math: Incremental Revenue = (Treatment Group Sales − Control Group Sales) × (Full Population / Test Population). Divide by incremental spend and you have incremental ROAS.
Marketing mix modeling (MMM) estimates each channel's contribution from historical data, finding statistical patterns in how spend and sales move together while controlling for seasonality, competition, and other confounders. What is marketing mix modeling goes deeper, but the practically useful output is a sensitivity curve showing expected ROAS at different spend levels, which is what makes marketing spend optimization possible.
Multi-touch attribution (MTA) distributes credit across touchpoints using algorithmic rules. Better than last-click, still not a measure of causality. Treat it as a diagnostic for funnel patterns rather than the source of truth for spend decisions.
Triangulating gets you the most: test to validate your highest-impact channels, model with MMM to see ROI across the full mix at different spend levels, and read MTA for which funnel patterns produce the most profitable conversions.
What's the difference between ROAS and ROI?
Metric | Measures | Includes profit margin? | Best used for |
|---|---|---|---|
ROAS | Revenue per ad dollar | No | Channel-level performance, platform optimization |
ROI | Profit per marketing dollar (after COGS) | Yes | Budget allocation, profitability decisions |
Marginal ROAS | Incremental revenue per incremental spend | No | Saturation modeling, spend curve planning |
ROAS is what platforms report and optimize toward. Useful for campaign diagnostics, but it isn't profit. A channel running 3:1 ROAS against a 70% COGS margin nets about 0.9:1 in actual profit per dollar, which is a losing trade.
ROI is the number your CFO cares about, because it forces fulfillment cost, returns, and real unit economics into the calculation. Most DTC brands should track both: ROAS at the channel and tactic level for daily optimization, ROI at the portfolio level for strategic reallocation.
How did one brand fix their ROI measurement and grow 34%?
David Protein, a DTC supplement brand, was running on platform attribution across Meta and Google. Their own analysis put platform overstatement at 36%, which is a large blind spot to be steering by.
They moved to incrementality-adjusted attribution paired with geo-lift testing. With true incremental ROAS in hand for each channel, they pulled spend out of the inflated ones and pushed it toward channels that had been quietly outperforming.
First year: 34% revenue growth and a 37% profit lift. Better measurement produced better decisions. The David Protein case study has the full breakdown.
Frequently asked questions
How often should I run incrementality tests?
Run tests when you launch a new channel or tactic, when spend shifts by more than 30%, and at minimum quarterly on core channels. Monthly testing gets expensive and adds noise. Annual testing misses shifts that matter. Quarterly is a reasonable baseline, with extra tests around major campaigns or changes to the media mix.
Can I measure ROI for channels like CTV and podcasting that don't have clicks?
Yes, as long as you can geotarget the media. CTV, podcasting, out-of-home, and direct mail are all measurable through geo-lift methodology. Compare sales in exposed versus control geographies and you have your true incremental impact, no click or view data required.
What's the difference between incremental ROAS and blended ROAS?
Blended ROAS is total revenue divided by total spend, an average across everything. Incremental ROAS is revenue lift per incremental spend, measured against a control baseline. Incremental is always the lower number and the more accurate one. Blended inflates because it counts non-incremental conversions and treats all spend as if it were incremental.
Should I optimize for ROAS or ROI in my ad platforms?
Both, at different levels. Optimize toward ROAS inside platform tools for day-to-day campaign performance, but allocate budget on true ROI, which is channel profitability after COGS. Test incrementally to find your real ROI per channel, then set platform ROAS targets that map to profitable unit economics.
Want to measure your true marketing ROI instead of guessing from platform dashboards? Schedule a demo to see how the WorkMagic platform turns data into profit.