Marketing Mix Modeling for DTC: methodology, setup, and results

by
Lauren Lauth, VP of Measurement
Why DTC brands get attribution wrong
Your last-touch attribution says TikTok drove 30% of revenue last month. The question that actually matters is whether those customers bought because of TikTok, or whether they would have bought anyway.
That distance between correlation and causation is where attribution systems break down at scale.
When you're running paid media on Meta, TikTok, Google and AppLovin at once, traditional multi-touch attribution firsttouch,lasttouch,data\-drivenfirst touch, last touch, data\-driven firsttouch,lasttouch,data\-driven can't separate each channel's true incremental impact from the baseline volume you'd sell with no ads running at all. David Protein ran into exactly this. Their attribution system was overstating Meta's contribution by 36%, which meant budget was being optimized toward revenue that was never there. After switching to causal measurement, they lifted revenue 34% and profit 37%.
Closing that gap is the job MMM exists to do.
What is marketing mix modeling?
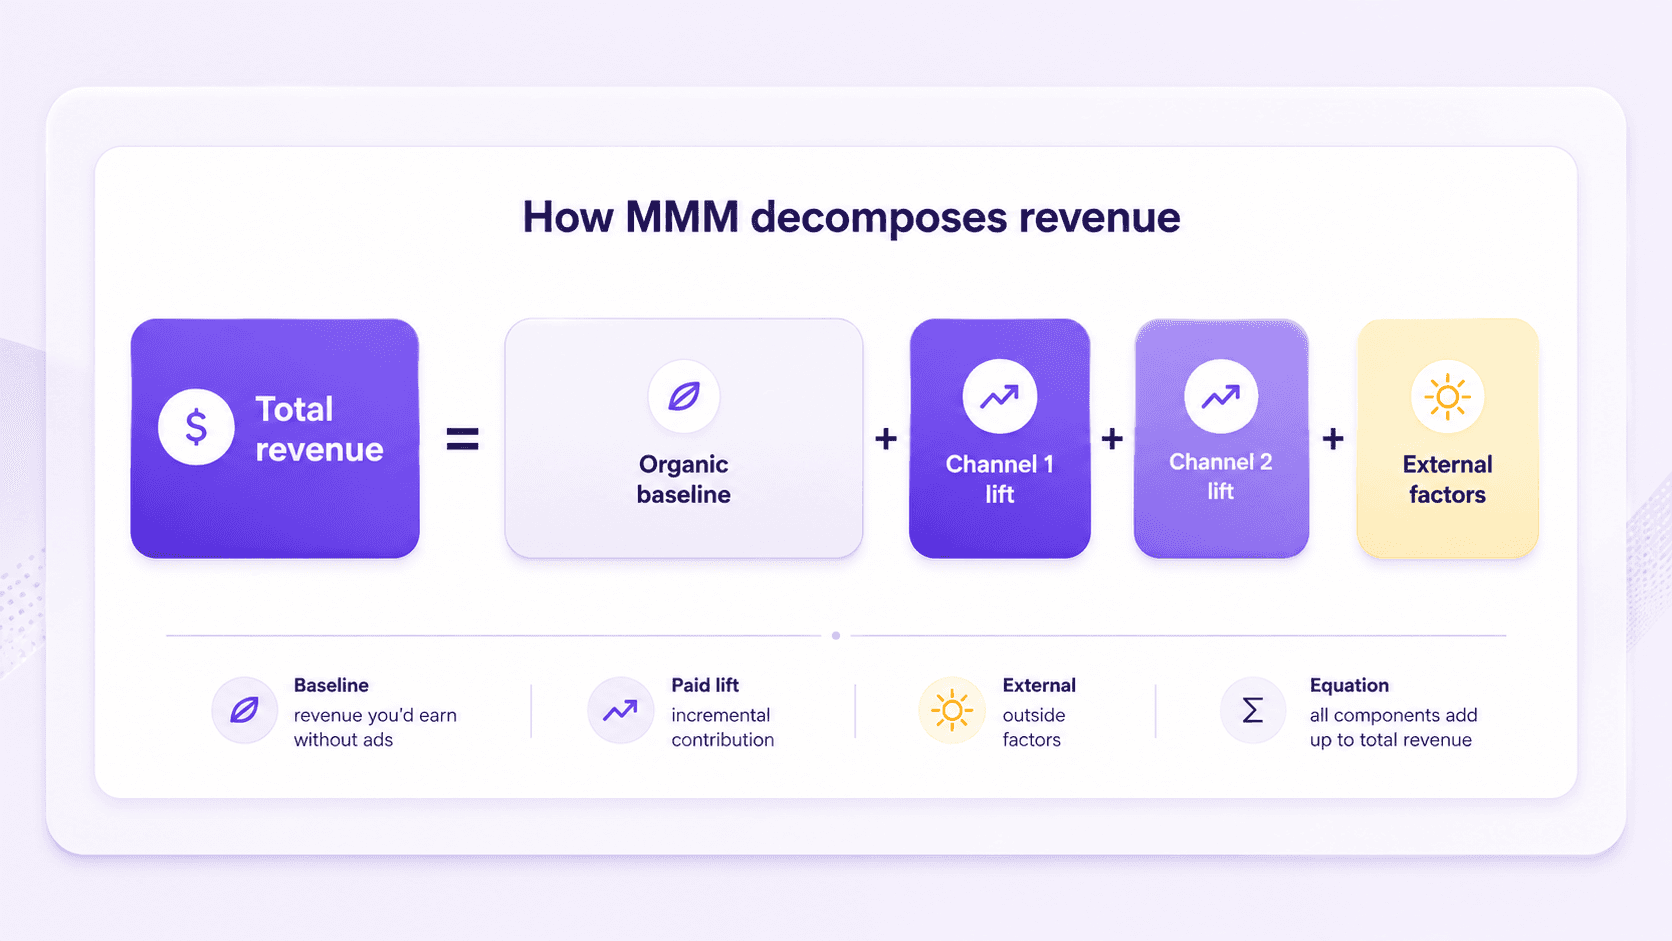
Marketing Mix Modeling is a statistical technique that isolates the incremental revenue contribution of each marketing channel by modeling historical spend against sales data.
Rather than deciding which touchpoint "caused" a conversion, MMM looks at marketing as one connected system and asks which spending patterns actually predict revenue.
It then splits total revenue into components: the organic baseline you'd sell with no ads, incremental lift from each channel, and external factors like seasonality or supply constraints.
Total Revenue = Organic Baseline + Channel 1 Lift + Channel 2 Lift + ... + External Factors
The technique is more than 40 years old. It started in CPG as a way to measure TV and print spend. For DTC brands it becomes necessary at scale, once enough channels overlap that click-based attribution stops holding up.
How MMM differs from standard attribution
Aspect | Last-Touch Attribution | MMM |
|---|---|---|
How it works | Credits the last click before a sale | Models historical spend patterns against revenue |
What it measures | Correlation - which channel was clicked last | Causation - which channel drove incremental volume |
Accounts for baseline | No | Yes. Separates organic from paid |
Handles non-clickable channels | No. Requires a pixel | Yes. Includes CTV, linear TV, retail |
Captures channel overlap | No | Yes, via saturation curves |
Needs historical data | 1–3 months | 12–24 months |
Updates frequency | Real-time | Monthly or quarterly |
Media Mix Modeling and Marketing Mix Modeling get confused constantly. The core technique is the same. MMM is the broader of the two and takes in non-media spend like email or content production.
Setting up MMM for your DTC brand
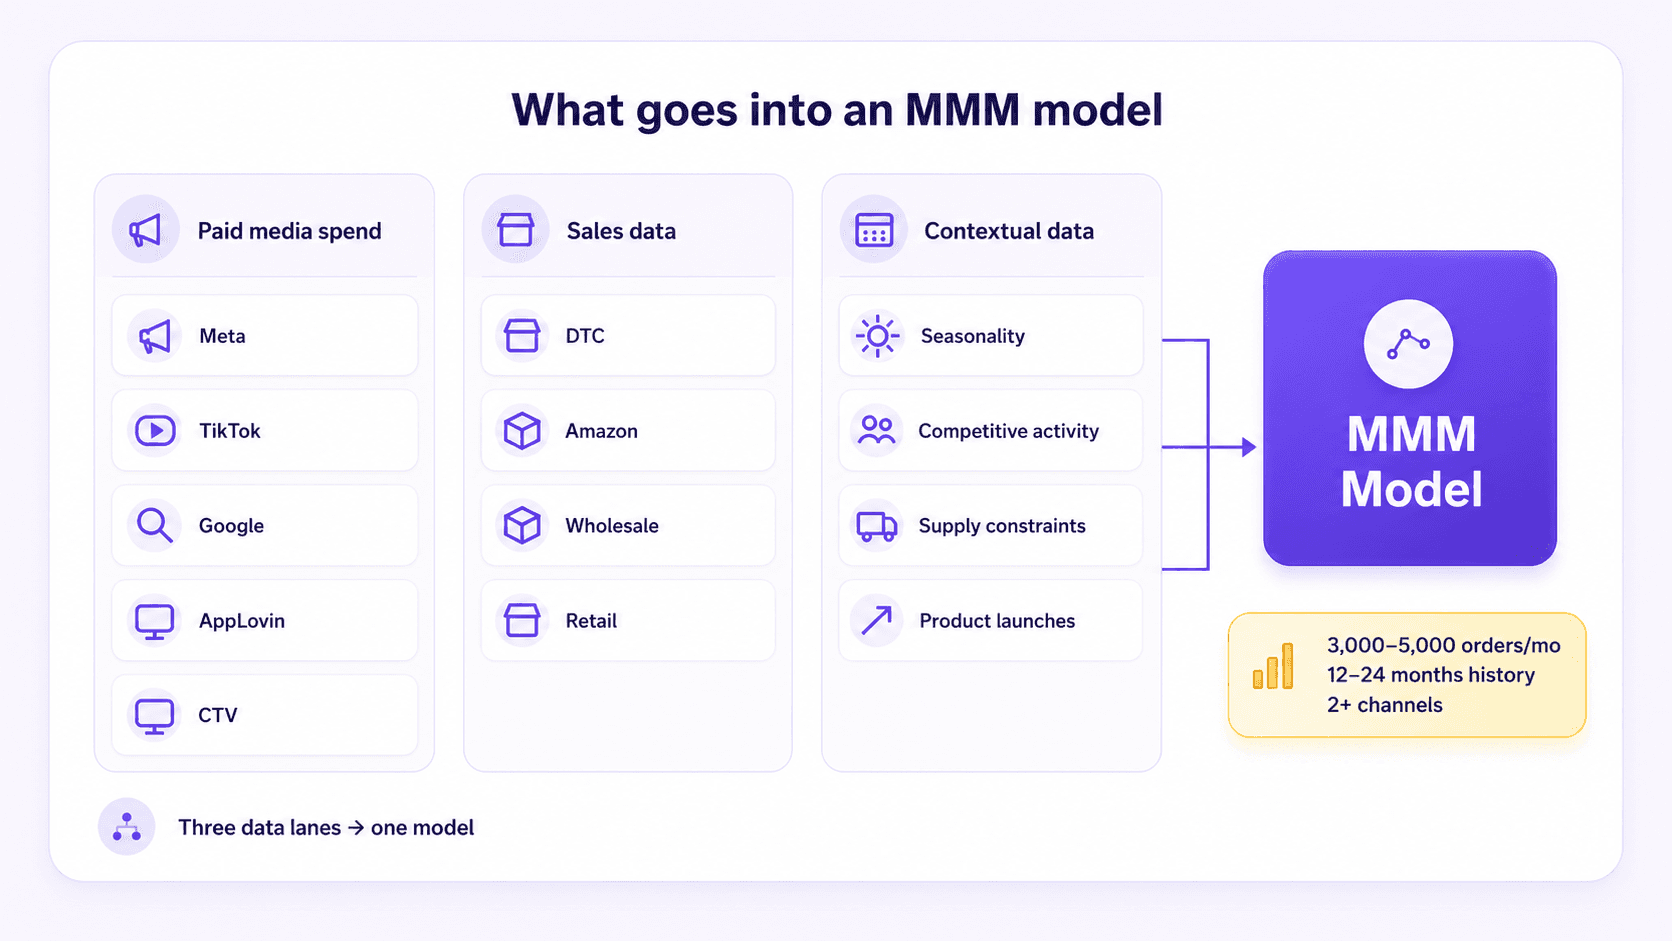
MMM needs three things: historical spend data, revenue data, and enough sales volume for the signal to surface.
Minimum requirements:
3,000–5,000 orders per month through DTC, or across all your sales channels, for statistical significance.
12–24 months of historical spend and revenue data. More history helps, because the model needs variation in spend to find patterns.
Multiple marketing channels. If Google Ads is your only line item, MMM won't help you; the signal is too thin.
What gets included:
Paid media spend across Meta, TikTok, Google, AppLovin, CTV and any other platforms.
Sales data from all your channels: DTC, Amazon, wholesale, retail.
Contextual data: seasonality markers, competitive activity, supply constraints, product launches.
Causal MMM, sometimes called Bayesian MMM, works differently from classic regression-based approaches. It builds in priors about how marketing behaves, diminishing returns at scale being the obvious one, which keeps the model from overfitting your history. Most modern vendors run some form of Bayesian approach.
Once the model trains, it outputs adstock curves showing how long each channel's effect lasts, saturation functions showing diminishing returns at higher spend, and channel contribution: what each channel actually drove.
Why standard MMM still underpredicts incremental lift
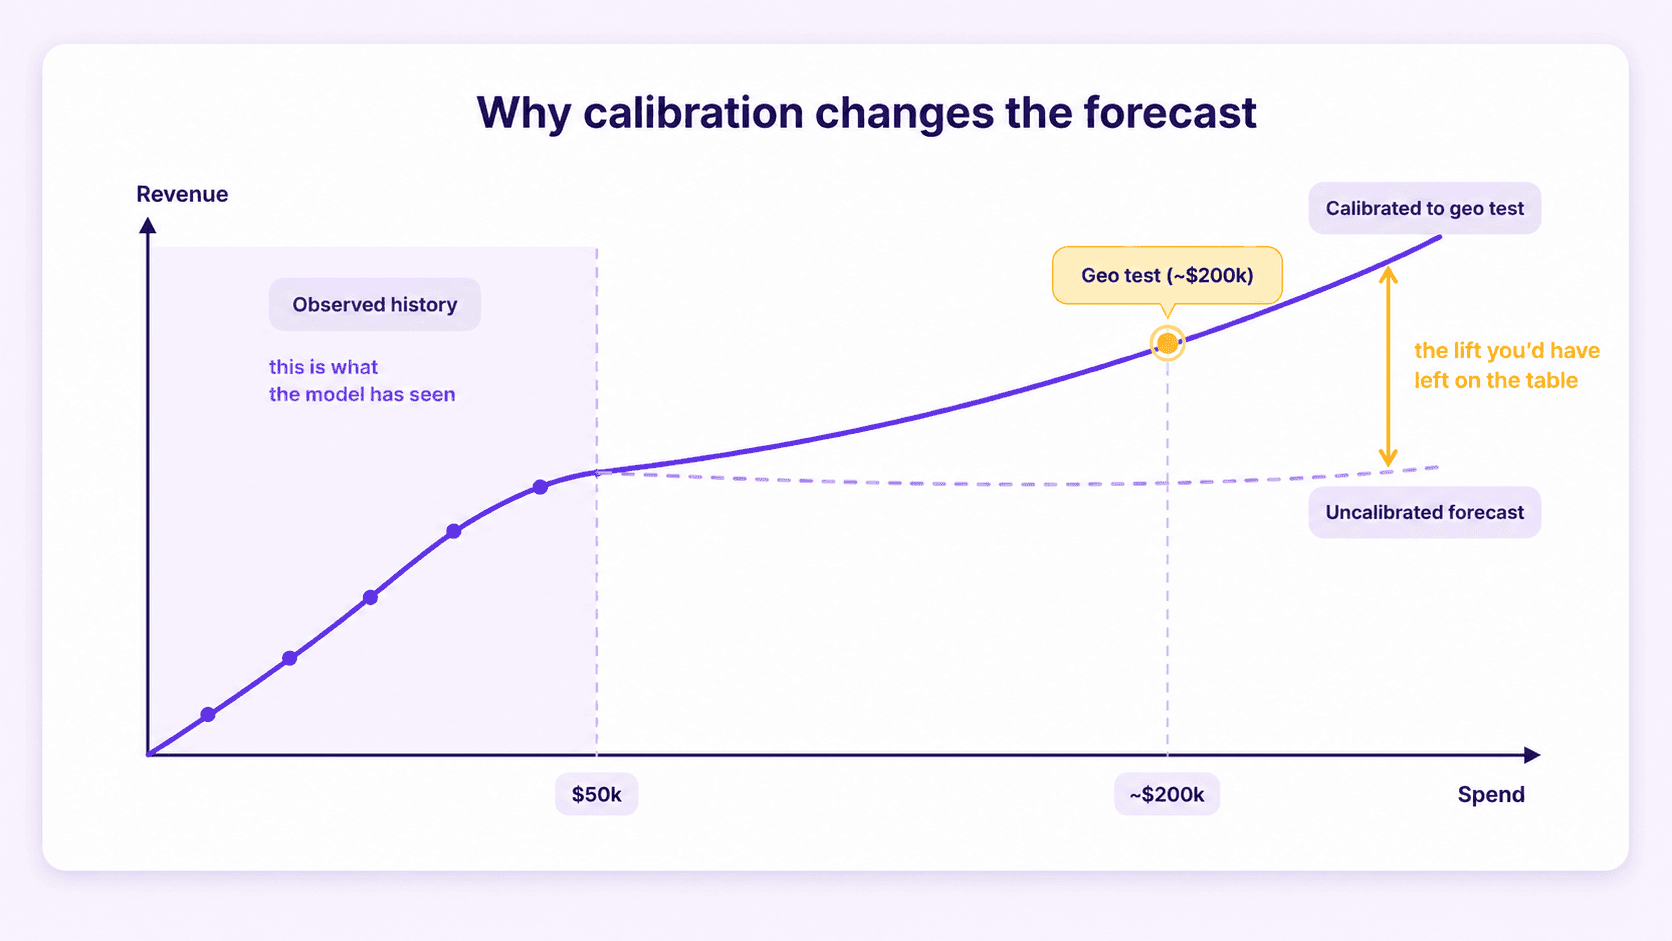
A model trained only on historical spend and sales will understate how much incremental volume more spend can actually buy.
It treats your past spend levels as the normal operating range for each channel. If you've never scaled TikTok from $50k to $200k a month, the model has no observation of what happens up there, so it forecasts conservatively.
That's the gap incrementality-calibrated MMM closes. Geo incrementality tests pause spend in some regions while it keeps running in others, and the sales difference between them gives the model a measured anchor instead of an assumption.
What comes back is a forecast rather than a history: what happens if you change spend, not only what happened while you didn't.
How to calibrate MMM with geo lift tests covers the mechanics in depth. The practical outcome is simpler. Your attribution and your forecast both become reliable enough to allocate real budget against.
When to recalibrate and how often
Models decay. Market conditions shift, platforms change algorithms, and your brand grows into different demand.
When to recalibrate MMM and why comes down to how much your business has changed. A major product launch, a large budget reallocation or a new market means recalibrating now. Without any of those, quarterly keeps your forecasts current.
Understanding key MMM concepts
Adstock is the carryover effect: someone who saw your TikTok ad last week converts this week. Saturation functions handle diminishing returns, since the 100th impression does less work than the first. Organic baseline isolates the revenue you'd have earned with zero paid spend, which is what makes a true incremental number possible in the first place.
How to evaluate MMM model fit R2,MAPER², MAPE R2,MAPE tells you how closely the model tracks historical revenue. A strong fit, meaning R² above 0.75, is a sanity check rather than a guarantee that the forecasts will hold.
Frequently asked questions
How much historical data do I need to build an MMM model?
You need 12–24 months of consistent spend and revenue data. More is better, since it lets the model pick up seasonal patterns, channel shifts and market shocks. If your business is younger than that, pair MMM with incrementality tests to ground truth the forecasts.
Can I use MMM for new channels I haven't spent on yet?
Not directly. MMM learns from historical patterns, so a channel with no spend history has nothing for the model to learn from. What you can do is run geo tests to measure incremental lift in a subset of markets, then fold those results back into the model.
How often does my MMM model need retraining?
Quarterly is the standard cadence. After a major shift like a product launch, a budget reallocation or a platform algorithm change, retrain right away. Stale models push budget in the wrong direction.
What's the difference between MMM and incrementality testing?
MMM works from historical data and estimates channel contribution retroactively. Incrementality testing measures the impact of spend changes directly, by holding out geos or users, which makes it causal but narrow. The strongest setup uses both: tests to calibrate the model, the model to forecast at scale.
Book a demo to see how incrementality-calibrated MMM works for your DTC business.