Marketing Spend Optimization: The Incrementality-based Approach

by
James Gerber, VP Strategy
Most brands optimize marketing spend the way they'd solve a math problem with fixed rules: 70% to proven channels, 20% to testing, 10% to experimentation. In fact, a quick Google search brings up suggestions like the 3-3-3 rule, the 70-20-10 rule, and the 40-40-20 rule.
The problem is that those rules aren't derived from what your channels actually drive. They're heuristics. They don't know the marginal return on each channel. They don't know which channels are generating incremental demand and which are capturing organic baseline you already created. Spend optimization that actually works starts somewhere else entirely.
Why rules-based optimization falls short
The 70/20/10 rule is a reasonable framework for thinking about risk tolerance in a media mix. It is not an optimization model. The same applies to CPA thresholds and ROAS targets: each is built on attributed revenue, which includes organic baseline sales and cross-channel halo effects that attribution cannot see.
A channel reporting a 4x ROAS might be capturing demand your brand awareness already created — customers who would have bought regardless. A channel reporting 2x ROAS might be generating new customers who then go on to purchase on Amazon, in retail, and on Shopify for years. Standard ROAS cannot distinguish between the two. Causal data can.
When spend optimization is built on attributed metrics, the resulting allocations reflect what platforms report, not what channels actually drive. The decisions look rigorous. The inputs aren't.
The foundation: incrementality baselines for every channel
Before any spend can be optimized, you need to know what each channel is actually causing. That means running incrementality testing across your active channels to establish the causal impact of each one — the revenue that would disappear if that channel went dark, measured across all channels where customers buy, not just the one being advertised on.
Those baselines feed into saturation curves: models that map each channel's causal revenue output across a range of spend levels. The curve shows where returns are still growing with additional investment, where they're plateauing, and where diminishing returns have set in. That relationship — between spend and incremental revenue at the margin — is what a true spend optimization model needs as its input.
Saturation curves and marginal ROAS
The saturation curve answers a specific question: what will the next dollar in this channel return at the current spend level? Not the average across all historical spend — the marginal return right now.
A channel can show a healthy average ROAS of 3.5x while its marginal ROAS sits below 1.0x, meaning the next dollar spent generates less than it costs. Average metrics hide this. The saturation curve makes it visible. And the correct optimization signal is always marginal, not average: rank every active channel by its current marginal ROAS and direct the next budget increment to whichever channel has the highest marginal return.
Incrementality-calibrated MMM builds these curves for every channel in the media mix, calibrated against geo lift results so the curves reflect causal returns rather than historical correlation. When the curves are grounded in incrementality data, the marginal ROAS figures they produce are reliable inputs for allocation decisions — not estimates based on what platforms claimed credit for.
The Media Budget Optimizer: from curves to allocations
Knowing where each channel sits on its saturation curve is the diagnostic. Knowing exactly where to allocate the next dollar is the decision. WorkMagic's Media Budget Optimizer (MBO) bridges that gap: it takes the saturation curve outputs from incrementality-calibrated MMM and translates them into specific budget recommendations by channel, down to the dollar, oriented toward a defined business goal.
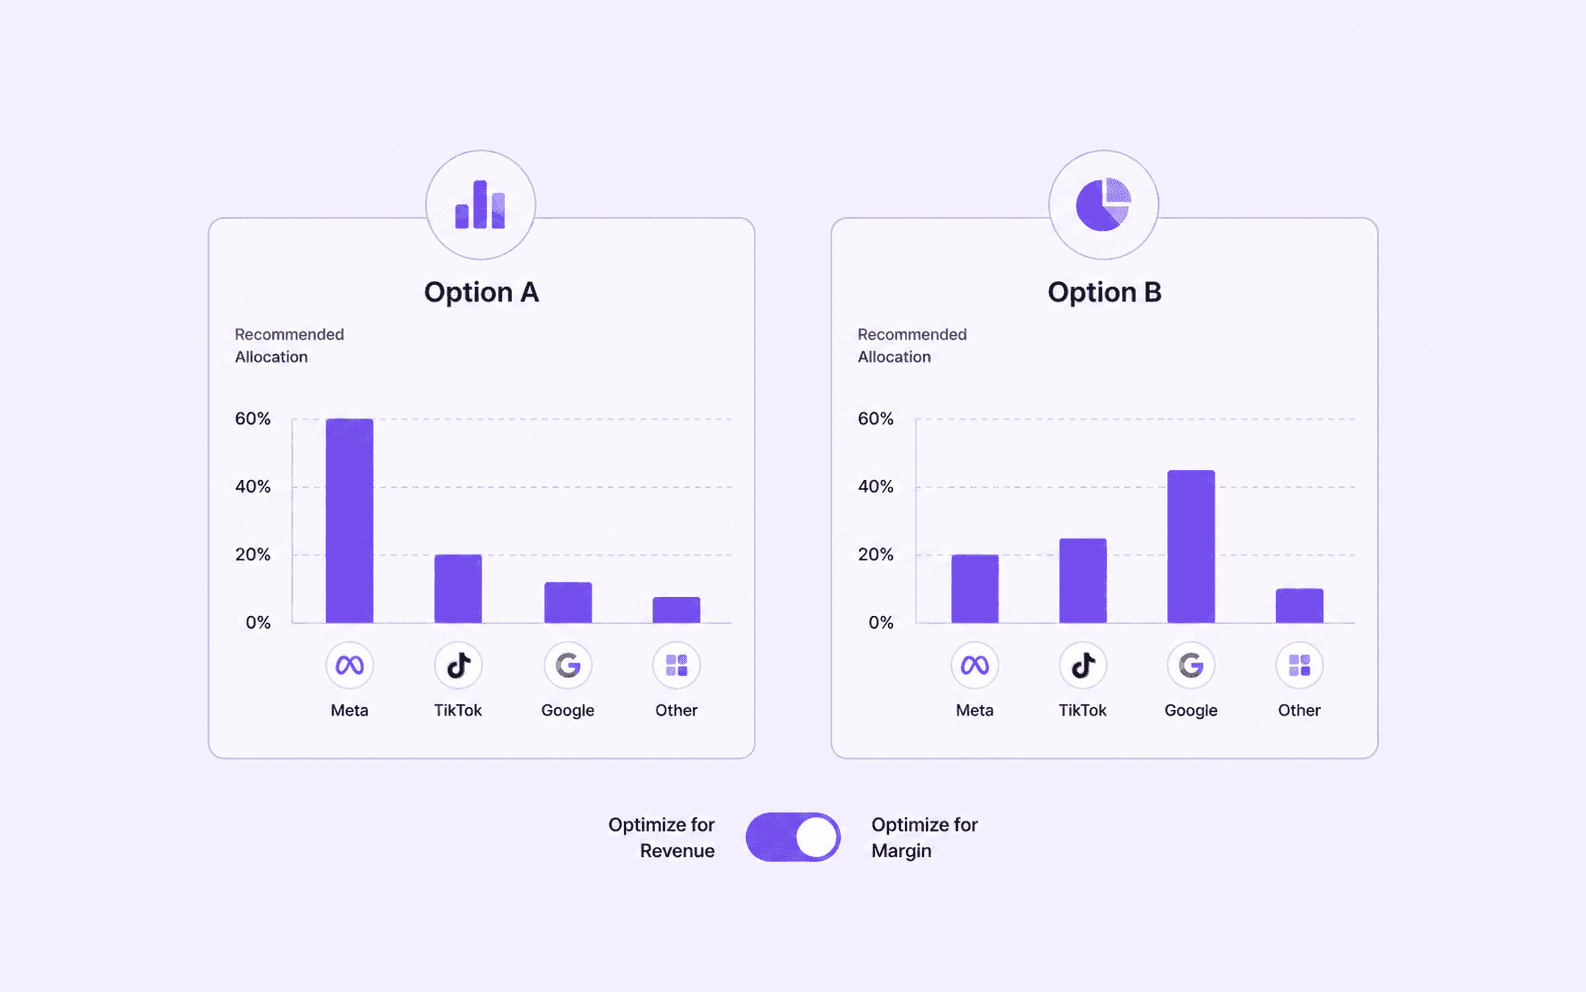
That goal orientation matters. The same model can be configured differently depending on what the business needs. A brand in growth mode can optimize for total incremental revenue, maximizing market share capture. A brand focused on profitability can optimize for contribution margin, finding the spend level where returns are at their peak before diminishing returns set in. The MBO produces different allocation recommendations for each objective, both grounded in the same causal data.
IndaCloud used this directly when leadership shifted their mandate mid-quarter from profitability to top-line growth. The MBO let them model the new scenario in minutes, finding the optimal channel allocation for the new objective without rebuilding from scratch. The outcome was a 150% increase in marketing profitability in January 2026 — a number both finance and marketing trusted because both teams were working from the same model.
The cross-functional payoff
Spend optimization built on saturation curves doesn't just benefit the marketing team. When allocations are grounded in causal projections, revenue forecasts become defensible to finance. The same model that recommends a channel allocation also projects the order volume that allocation will produce, which operations teams can use to plan inventory and fulfillment in advance rather than reacting to a stockout after a campaign launches.
David Protein found this cross-functional alignment to be one of the most significant outcomes of their measurement program. As they scaled across DTC, Amazon, and retail, finance and ops needed a shared forecast they could act on. With incrementality-calibrated MMM in place, each function could plan from the same causal baseline rather than reconciling independent assumptions in planning meetings.
When finance approves a budget grounded in causal evidence, marketing executes with confidence. When ops receives a demand signal they trust, inventory planning becomes proactive. Marketing spend optimization, done properly, isn't just a media decision — it's a cross-functional planning tool.
Frequently asked questions
How to optimize marketing spend?
Optimizing marketing spend requires three inputs in sequence: incrementality baselines that establish what each channel causally drives, saturation curves that show how each channel's returns change as investment scales, and marginal ROAS as the signal that directs each successive dollar to the highest-returning channel. Rules-based frameworks like 70/20/10 are heuristics that don't reflect channel-specific saturation or causal impact. A Media Budget Optimizer built on incrementality-calibrated MMM translates those inputs into specific allocations oriented toward a defined business goal.
What is marketing spend optimization?
Marketing spend optimization is the process of allocating budget across channels to maximize a chosen business outcome — revenue, contribution margin, or new customer acquisition — based on each channel's causal impact and diminishing returns curve. It is distinct from rules-based allocation (fixed percentage splits) and from ROAS-chasing (optimizing toward attributed platform metrics). True spend optimization requires causal measurement as its foundation, so that the returns being optimized against reflect what channels actually drive, not just what they correlate with.
What is the 70/20/10 rule for marketing budget?
The 70/20/10 rule allocates 70% of marketing budget to proven, lower-risk channels, 20% to channels with emerging evidence, and 10% to experimental or high-risk investments. It is a useful framework for managing risk across a media mix but is not a spend optimization model. It does not account for channel-specific saturation, marginal returns, or the causal contribution of each channel. A brand following the 70/20/10 rule may be significantly over- or under-investing in individual channels relative to where their marginal returns actually are.
How do you know when to increase or decrease marketing spend?
The signal to increase spend in a channel is a marginal ROAS above your profitability threshold at your current spend level — meaning the next dollar will generate a return that justifies the investment. The signal to decrease is a marginal ROAS that has fallen below that threshold, indicating diminishing returns have set in. Both signals come from the saturation curve for that channel, not from average ROAS or platform-reported figures. Average ROAS can look healthy while marginal ROAS has already turned negative — the saturation curve is the only way to see the difference.