Saturation Curves Explained: How to Optimize Budget Across Your Entire Media Mix

by
Isaac Lee
In our last post, we broke down marginal ROAS — why it's a more useful signal than average ROAS, and how it tells you whether your next dollar of ad spend is worth it on a given channel.
If you haven't read it, here's the short version:
ROAS takes your total revenue attributed to paid media and divides it by total spend. In other words, it shows you your historical, aggregated performance.
Marginal ROAS, by contrast, is the slope of the curve at your current spend level. It tells you what the next dollar will return, not what the last thousand already did. And knowing where you sit on that curve changes everything about how you should allocate budget.
But here's the thing. Understanding one curve is only the warm-up. The real game is figuring out how to allocate budget across three or more channels (the average WorkMagic client has about 3.5 ad platforms connected), each with their own curve, their own diminishing returns, and their own constraints.
Knowing one channel's saturation curve is not enough
Ad budgets don't live in isolation. Pulling $20K from Meta and putting it somewhere else sounds simple ... but where? And how much? If you don't have visibility into the saturation curves of every channel in your mix, you're still making that decision in the dark.
The temptation is to default to the channel with the highest reported mROAS. After all, by definition, that would give the most bang for your buck.
But this breaks down quickly. The spend required to hit the same mROAS level might be larger than the budget you're working with, as this example illustrates.
Which brings us to a subtlety that trips up even experienced marketers — and is exactly why single-channel thinking falls apart when you're managing a full media mix.
How the analysis works, really
The first step is building a saturation curve for each ad tactic or platform using historical spend and outcome data, calibrated with incrementality where possible.
This is harder than it sounds.
Doing it properly requires advanced modeling, fed by months or years of daily, geo-level spend and conversion data. The models also have to account for adstock (the carryover effect of past media spend), seasonality, promotions, and macroeconomic trends simultaneously. Miss any of these, and the curve shifts and becomes inaccurate.
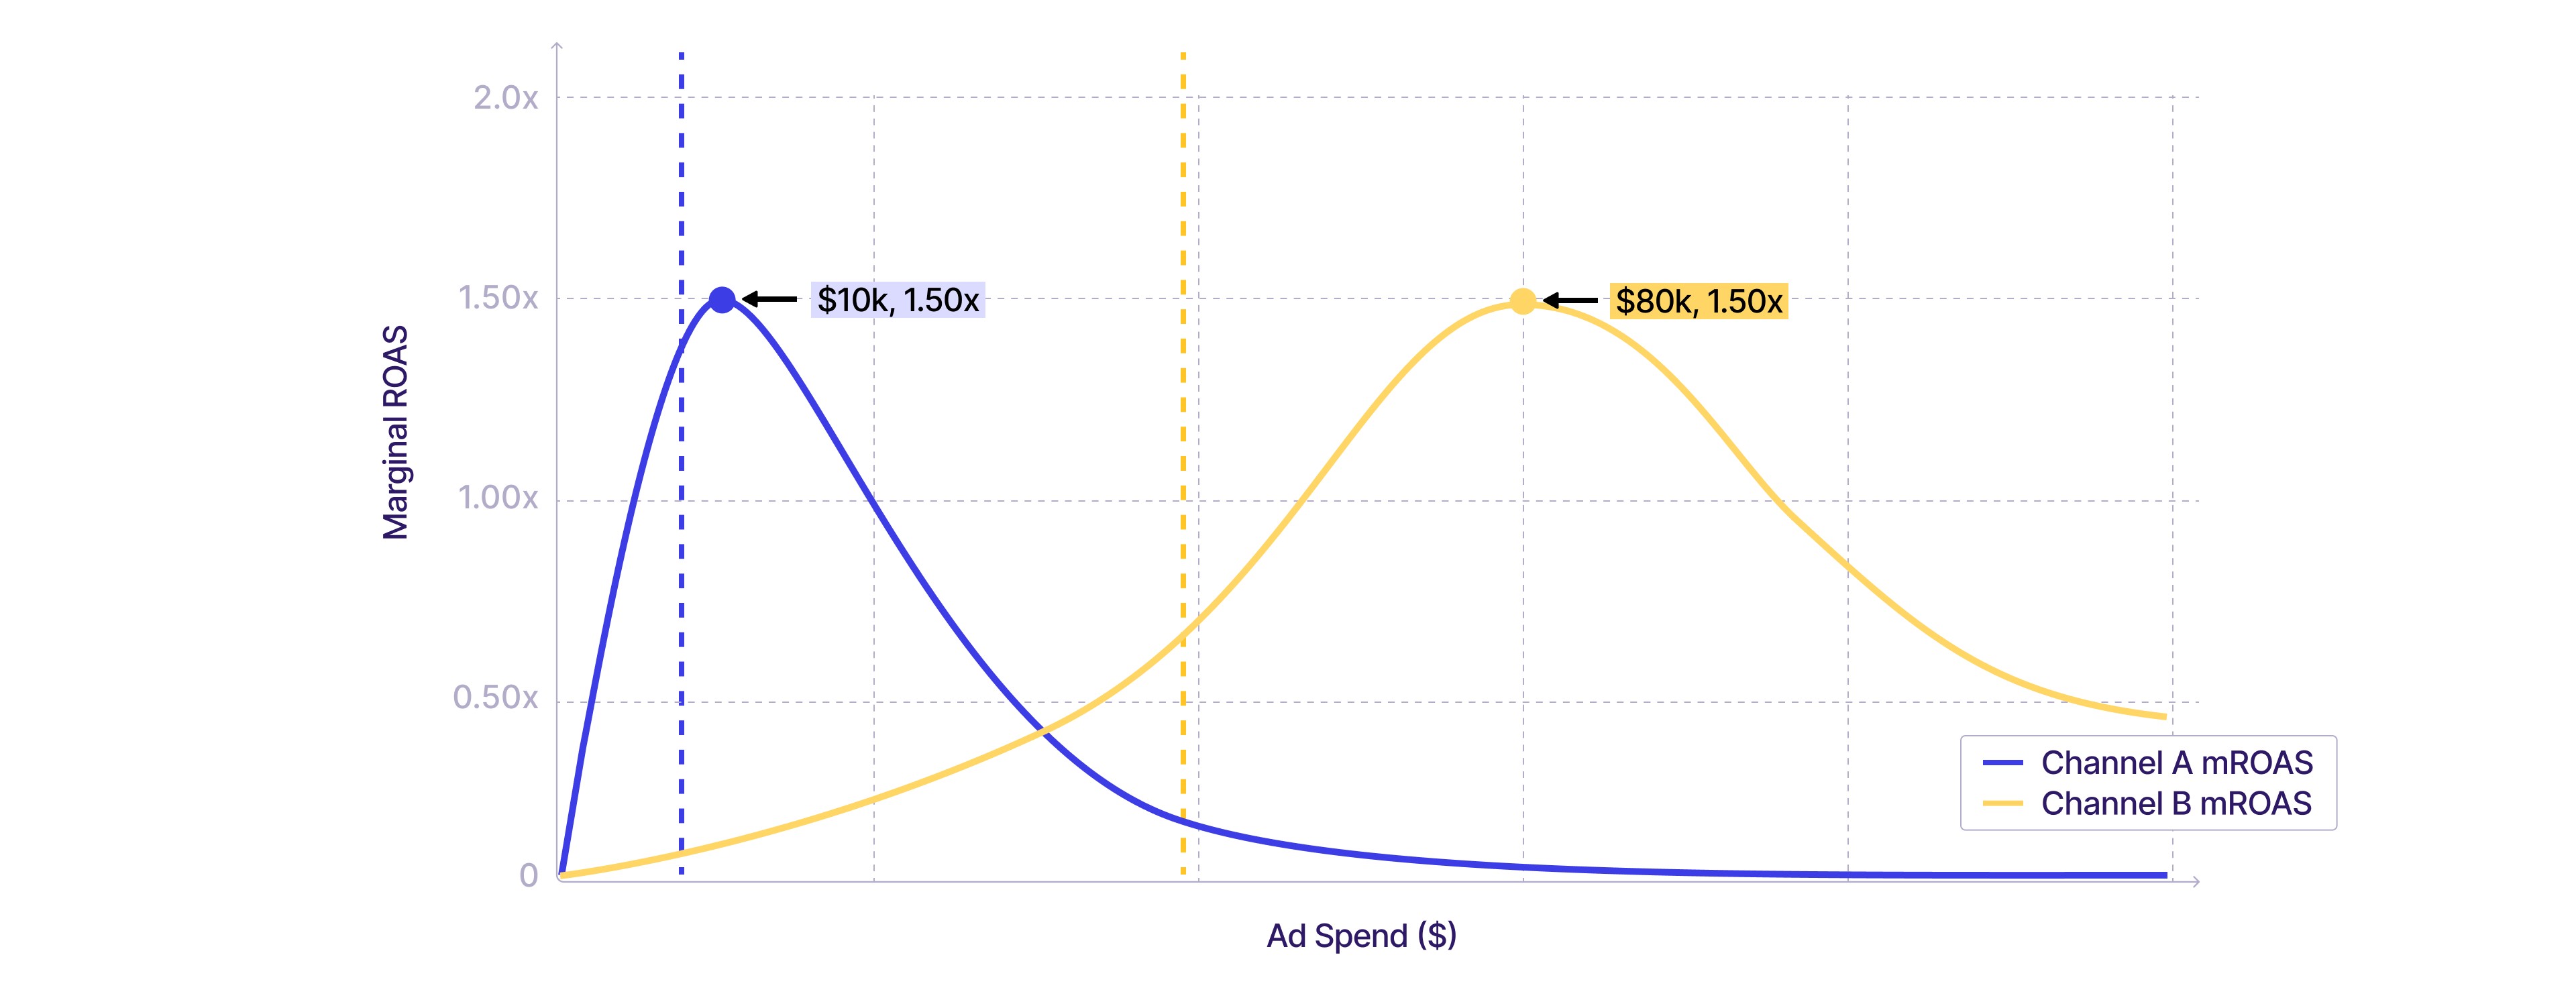
Once you have those curves, budget constraints immediately complicate the picture. With Channel A above at maximum mROAS, and Channel B showing the potential for a similarly high mROAS, it sounds like you should pour money in, right? Not necessarily.
To hit the same peak as Channel A, Channel B would need close to 3X the ad budget.
Most brands can't afford to starve other channels on the promise of returns they'd need to spend their way to first; they'll need to consider all their channels and respective budgets in tandem.
This is why you can't chase the highest mROAS signal in isolation. The right question isn't "which channel has the best marginal returns?" — it's "given my total budget and each channel's curve, how do I allocate dollars to maximize the whole mix?"
That requires a model. One that looks at every curve simultaneously, respects your budget constraints, and finds the allocation that gets you the best aggregate outcome — whether that's ROAS, profitability, or CAC.
Example
Here's what this looks like in practice. Say you're running three channels — Meta, Google, and TikTok — with a combined monthly budget of $80K, currently split $40K / $30K / $10K.
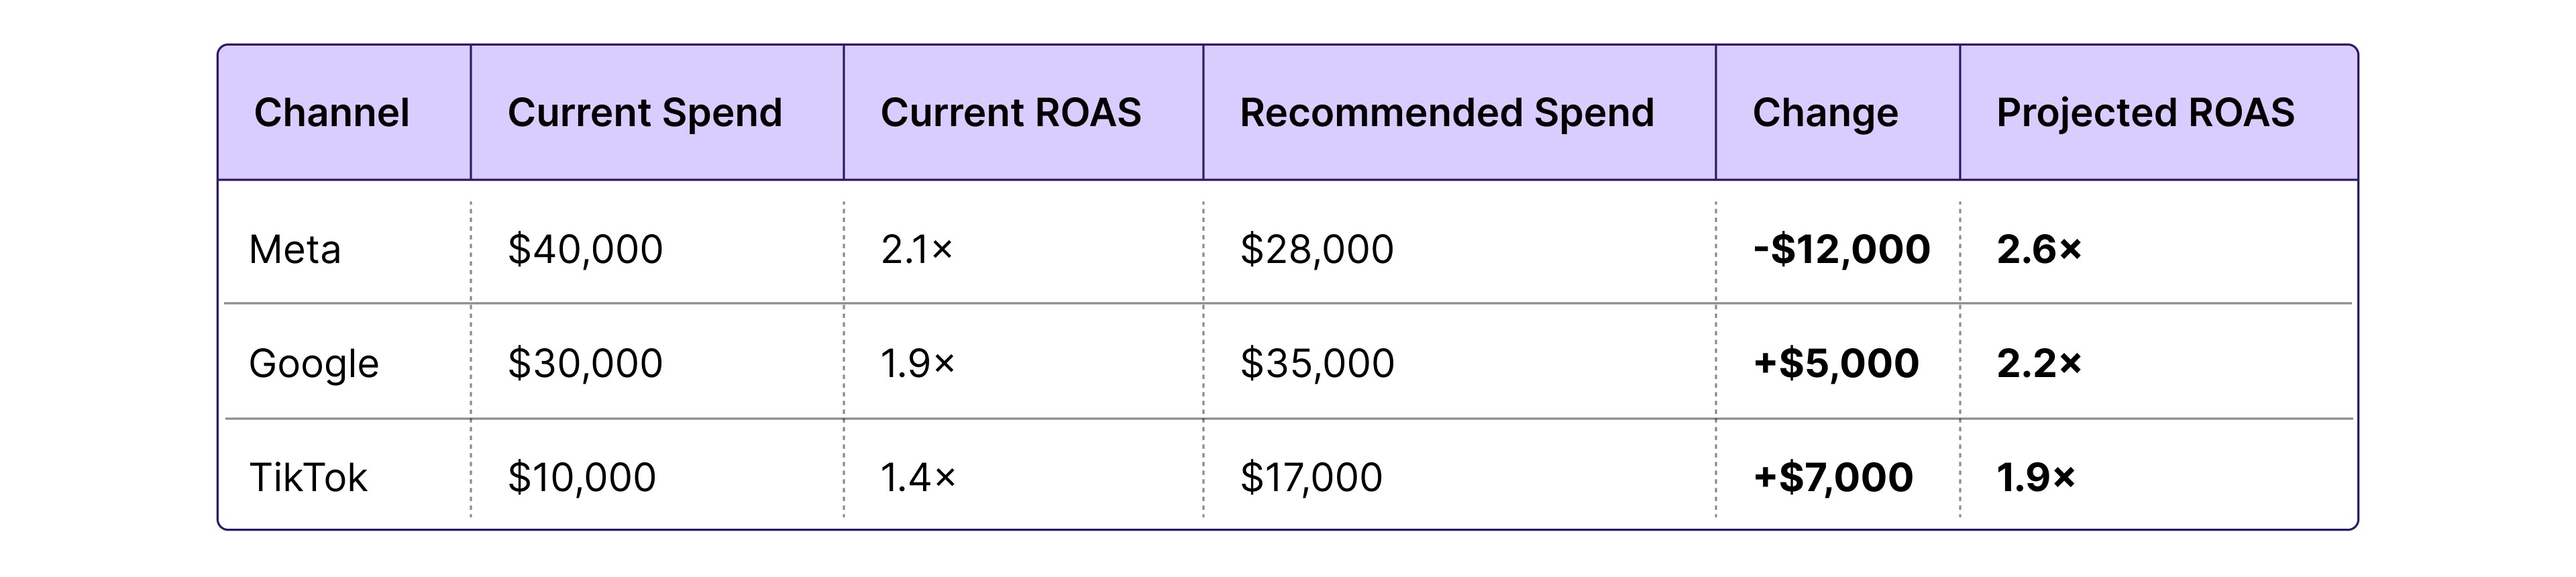
To take the most straightforward approach, you'd look at ROAS by channel and double down on the winner. But once you model the saturation curves, a different picture emerges:
Side note, had the analysis been done on ROAS instead, you might even be tempted to continue to increase spend. As we discussed in our blog on marginal ROAS, overall ROAS might still be increasing past the point of peak mROAS, to the detriment of overall efficiency. Selecting the right metric as your North Star becomes even more important.
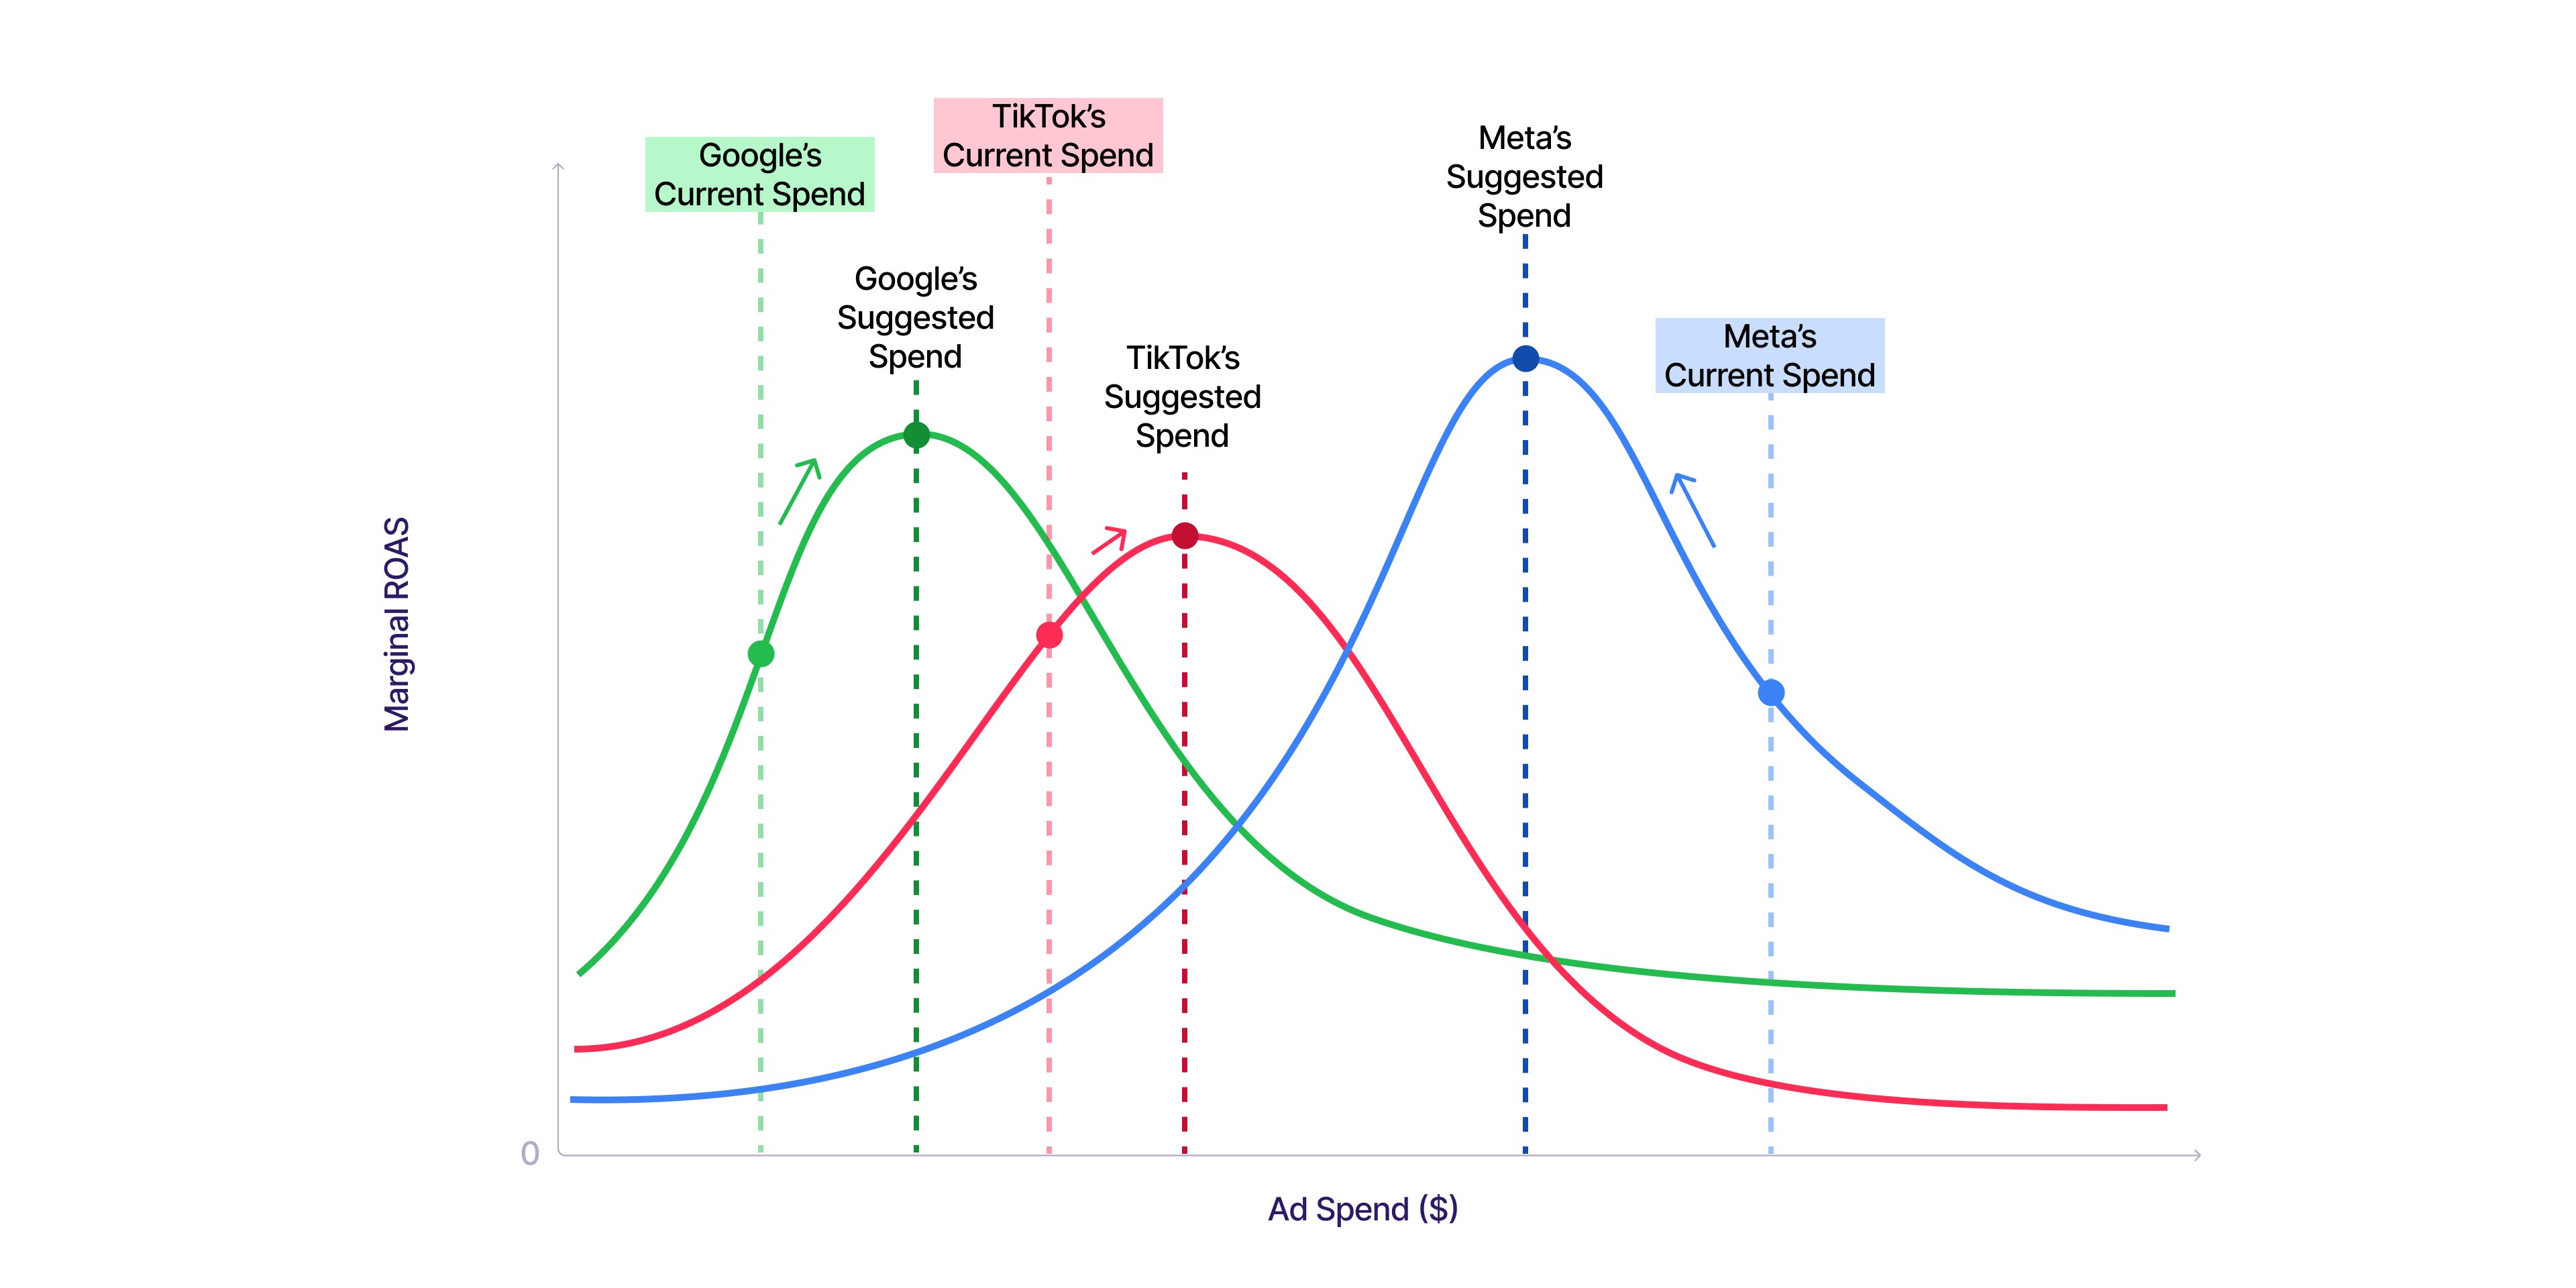
Back to the graphs:
Meta is past its peak mROAS, therefore more spend there is actively diluting your blended returns. The model thus suggests reducing spend by $12,000 and redistributing it to other channels.
Google and TikTok both have headroom left on their curves, so the model shifts dollars toward them. The total budget hasn't changed. But the projected blended ROAS moves from roughly 1.9× to 2.3× — just by redistributing what you're already spending.
That's the core promise of media mix optimization: not necessarily spending more, but spending smarter across the full picture.
That was a mouthful. Still with us? We're just scratching the surface — operationalizing this process comes next.
How brands can operationalize this
Can teams do this without a budget recommendation tool like the ones in WorkMagic? Certainly, although getting there requires a few pre-requisites.
We've covered the need for ad platform-level incrementality testing and saturation curves, but most importantly, you need the data science capability to actually run all of this, at once. That means you need:
The ability to establish incrementality at the tactic level, across all your channels.
The ability to calibrate your MMM with those incrementality results, so the curves you're optimizing against actually reflect reality.
Someone who can read into the recommendations and understand the underlying factors driving each one, because a model's output without interpretation is just a number.
Automated calculation and modeling of recommendations on an ongoing basis, because MMM curves in isolation don't tell you anything about where to assign the next dollar.
That last point matters more than people expect. This is not a spreadsheet exercise. The interactions between channels, the shifting nature of saturation curves, and the volume of data involved make manual analysis impractical — and slow. By the time you've hand-modeled three curves, the fourth channel's spend pattern has already changed.
The workflow looks like this: run lift tests to establish incrementality → calibrate your MMM → generate allocation recommendations based on marginal ROAS → execute → rinse and repeat.
Best practices, and a few caveats
A few things worth keeping in mind before you make your next measurement move:
Saturation curves aren't static. A curve modeled on last quarter's data may not reflect today's competitive landscape, seasonality, or audience behavior. Treat these as living models that need refreshing — not one-time outputs you optimize against indefinitely.
The "optimal" allocation has to actually be operational. A model might tell you to cut Meta spend by 60% overnight — but if you have creative in-flight, audience pools being built, or contractual minimums in place, a hard pivot isn't realistic. Phase your changes, and pressure-test recommendations against operational constraints before executing.
Your MMM needs to consider incrementality. Incrementality is too valuable of a signal to ignore, especially for media mix models that are tasked with making tough recommendations on spend allocation. This doesn't mean that every tactic has to be tested (though we recommend it), but it does mean that the model needs grounding in some level of incrementality to work effectively.
Know what goal you're optimizing for. A model optimized for blended ROAS will give you different allocations than one optimizing for new customer CAC or contribution margin. Be explicit about the objective upfront — otherwise you'll get an answer that's optimal for a question you weren't actually asking.