Marketing Budget Allocation: A Framework Built on Causal Data

by
James Gerber, VP of Strategy
Most marketing budget allocation advice comes down to percentages. Spend 70% on proven channels, 20% on emerging ones, 10% on experiments. Or follow the 60/40 rule: brand building versus sales activation. Or benchmark against industry averages: 7–12% of revenue for established companies, up to 30% for high-growth startups.
These frameworks are useful for structuring a conversation. They are not useful for deciding where the next dollar should go. A percentage rule doesn't know what your channels are actually driving. It doesn't know which channels are approaching saturation and which have room to scale. It doesn't know that the channel with your lowest reported ROAS might be generating more incremental revenue than the one at the top of your dashboard.
Marketing budget allocation that actually improves performance requires causal data, not benchmarks.
Why rules-based budget allocation breaks down
The 70:20:10 rule, the 60:40 split, the revenue percentage benchmarks: each is a heuristic that describes what a typical brand does, not what a specific brand should do given its channels, its saturation curves, and its actual incremental returns.
The deeper problem is that these rules are applied to attributed metrics. When a brand decides to put 70% of its budget into "proven channels," it usually defines "proven" by platform-reported ROAS. But platform ROAS includes organic baseline demand that would have arrived regardless, halo effects credited to the wrong channel, and double-counting across platforms. The channels that look most proven in attribution are not always the channels generating the most incremental revenue.
Budget allocation built on attributed metrics optimizes for the appearance of performance, not the reality of it.
The foundation: what each channel actually drives
For a full breakdown of the spend optimization workflow including saturation curves and marginal ROAS, see how to optimize marketing spend and marketing spend optimization.
Before any budget can be allocated intelligently, you need to know the causal contribution of each active channel: the revenue that would disappear if that channel went dark, measured across all channels where customers buy.
That means running incrementality testing across your media mix. Geo incrementality testing holds matched geographies out from ads while test geographies run normally, then compares total revenue across Shopify, Amazon, retail, and all other channels. The difference is causal revenue: not what platforms reported or what attribution credited, but what the channel actually drove.
This step is non-negotiable. Without causal baselines, every allocation decision is made against a number that includes organic demand the brand was already going to capture. Channels that look strong in attribution because they're good at capturing existing demand will be overweighted. Channels that drive significant halo revenue on Amazon or retail (invisible to attribution) will be underweighted.
David Protein found that traditional attribution was overstating DTC orders by 36%. That overcount was shaping budget decisions. Finance and marketing were allocating against a number that included a third of purchases that would have arrived regardless of ad spend. For a framework on aligning both functions around causal data, see the Aligning Marketing and Finance Performance one-pager.
Building the allocation framework: saturation curves and marginal returns
Once causal baselines exist, the next layer is understanding how each channel's returns change as spend scales. That's the saturation curve: a model showing incremental revenue at each spend level, revealing where returns are growing, where they're plateauing, and where diminishing returns have set in.
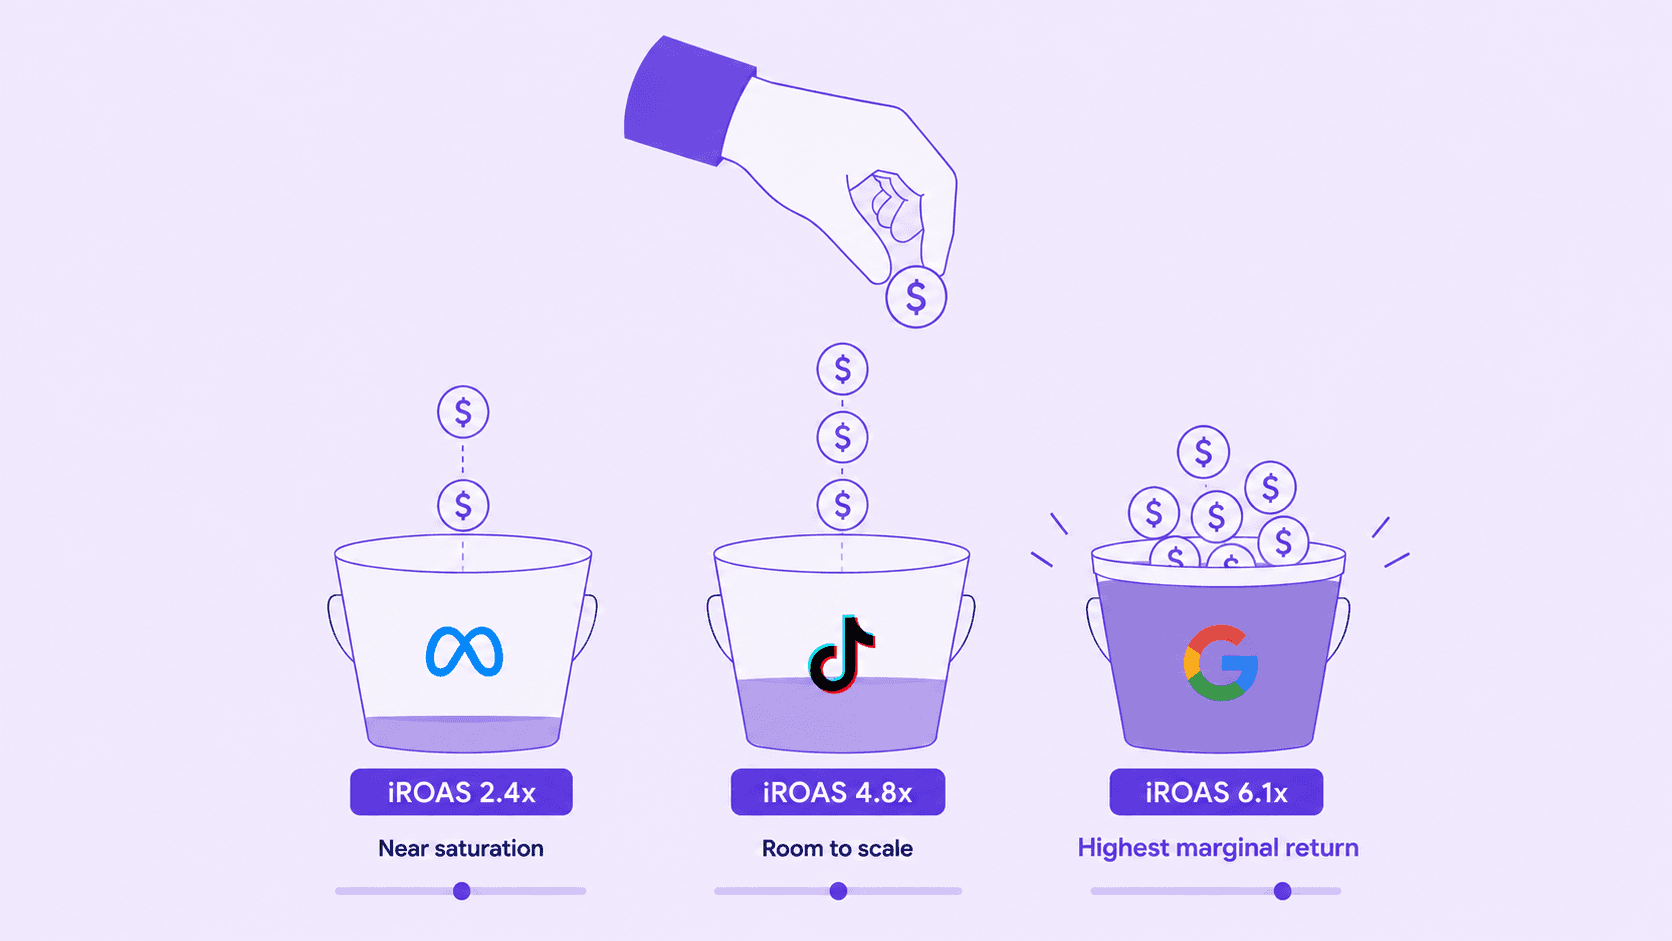
The allocation signal that comes from saturation curves is marginal ROAS: the return the next dollar will generate at the current spend level. A channel with a healthy average ROAS of 4x can have a marginal ROAS below 1x if it's past the point of peak efficiency. The average looks fine. The marginal signal says to stop.
Incrementality-calibrated MMM builds these curves for every channel in the mix, grounded in geo lift results rather than attributed data. The result is a set of saturation curves that reflect true causal returns; these are inputs a budget allocation model can actually rely on.
What a marketing budget allocation framework looks like in practice
A causal marketing budget allocation framework has three components:
Incrementality baselines for every channel. Run geo lift tests across active channels to establish the causal revenue each one drives, including halo effects on Amazon and retail. This is the foundation everything else is built on.
Saturation curves showing marginal returns at current spend. Feed geo lift results into incrementality-calibrated MMM to build curves for each channel. These show where each successive dollar will land relative to diminishing returns: the inputs a budget optimizer needs.
A goal-oriented budget optimizer. WorkMagic's Media Budget Optimizer takes saturation curve outputs and translates them into specific channel allocations, down to the dollar, oriented toward a defined business goal, whether that's maximizing total incremental revenue or optimizing contribution margin. IndaCloud used this directly when their mandate shifted mid-quarter, modeling a new allocation scenario in minutes and achieving a 150% increase in marketing profitability. King Smith took a similar reallocation approach using data-driven attribution, consolidating cross-channel data to guide Google Ads budget decisions and achieving a 23% ROAS improvement and 17% sales growth.
What to include in a marketing budget allocation plan
Whether you're building a quarterly budget plan or a simple allocation template, a causal framework should capture:
By channel: Current spend, attributed ROAS, incremental ROAS (from geo lift), marginal ROAS at current spend, saturation status (room to scale / approaching saturation / past peak), and recommended next-dollar allocation.
By business goal: Total incremental revenue target, contribution margin target, or new customer acquisition target, and the channel mix that the MBO recommends for each.
Cross-functional inputs: Finance's profitability threshold (minimum iROAS to justify spend), ops' inventory capacity by projected order volume, and marketing's channel-level confidence scores based on recency of lift test data.
This is the structure that lets finance approve a budget grounded in evidence and marketing execute a plan both teams built from the same model. For cross-channel benchmarks on iROAS and media performance across DTC brands, the Media Performance Index 2026 provides useful context for calibrating channel-level expectations.
How do you allocate a marketing budget?
The correct allocation sequence is: establish incrementality baselines for each channel, build saturation curves that show marginal returns at current spend levels, and direct budget to the channel with the highest marginal return. Repeat the calculation each time spend shifts. This process, not percentage rules, is what separates allocation that compounds returns from allocation that chases metrics that platforms have every incentive to inflate.
Frequently asked questions
How do you allocate a marketing budget?
Allocating a marketing budget accurately requires three inputs: incrementality baselines that establish what each channel causally drives, saturation curves that map how each channel's returns change as spend scales, and marginal ROAS as the signal for where the next dollar should go. Percentage-based rules like 70:20:10 are useful starting frameworks but don't account for channel-specific saturation or causal returns. A budget allocation model calibrated with geo lift test results will consistently outperform one built on attributed metrics.
What is the 70 20 10 rule for marketing budget?
The 70:20:10 rule allocates 70% of marketing budget to proven channels, 20% to emerging channels, and 10% to experimental investments. It is a reasonable risk management heuristic but not an optimization framework. It doesn't account for where each channel sits on its saturation curve, what each channel's marginal return is at the current spend level, or whether attributed performance reflects causal impact. A brand following this rule may be significantly over- or under-investing relative to where incremental returns actually are.
What are the 4 types of budget in marketing?
The four common types of marketing budget are: percentage of revenue (allocate a fixed % of projected or past revenue), competitive parity (match competitor spending), objective and task (budget backward from goals), and zero-based (build from scratch each period, justifying every line item). Each approach has tradeoffs. None of them incorporates channel-level incrementality data or saturation curves into the allocation decision. For DTC brands where causal measurement is available, incrementality-based allocation (directing spend based on marginal returns) produces better outcomes than any of the four traditional approaches.